 Stay
Stay 
Trading Conditions
Products
Tools


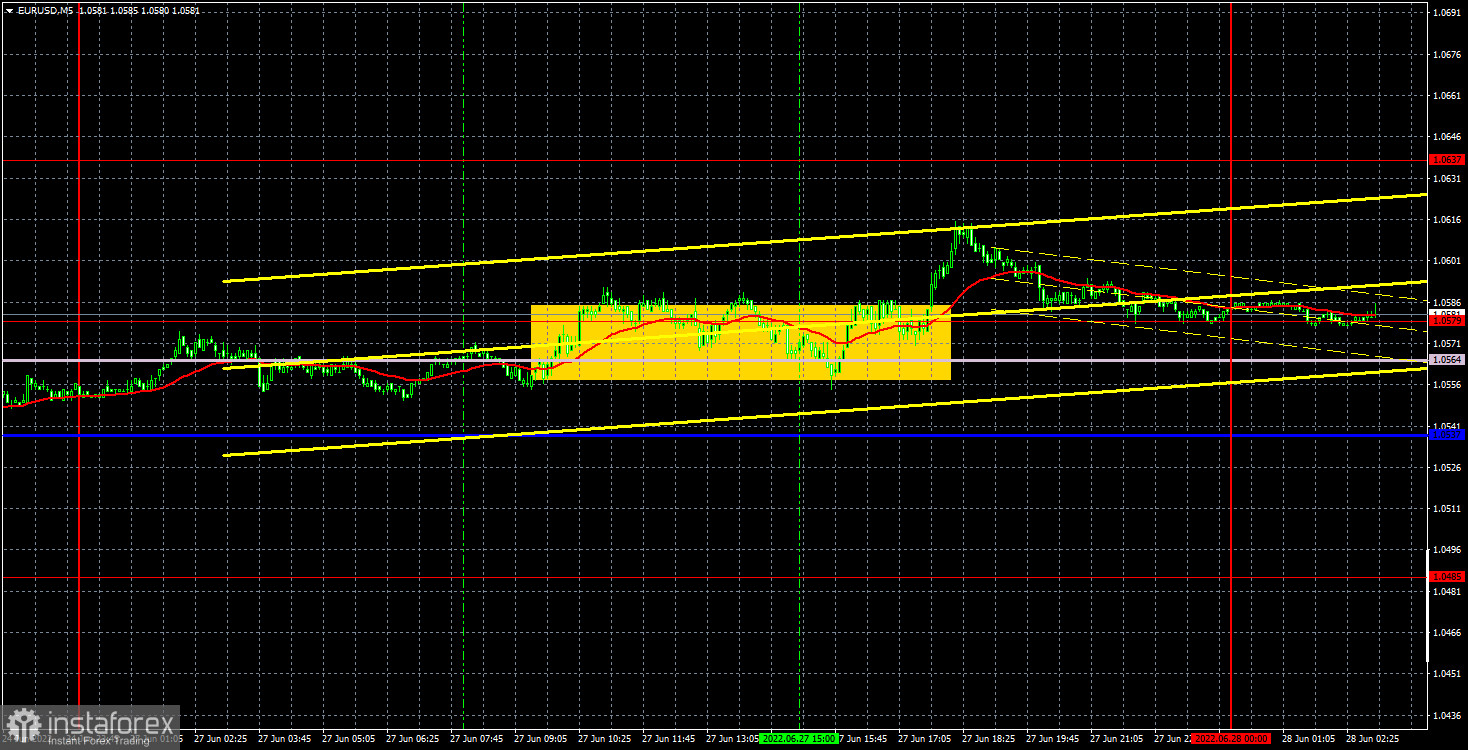
Yesterday, the EUR/USD pair again did not show the movement that everyone expects from it. Recall that the last few months have taught us that volatility is very high, and there are practically no flat periods. But in the last two weeks, the pair has been trading very poorly, the direction of movement is constantly changing, and the price is inside a limited range. Naturally, it is extremely difficult to trade in such conditions, and making money is even more difficult. The pair spent most of the day near the Senkou Span B line and the extreme level of 1.0579, but by the end of the day it still managed to grow. Even today, growth may be replaced by a new round of decline. There were few macroeconomic statistics on Monday. The Durable Goods Orders report was not the most important, and it was better than expected. However, the US dollar failed to capitalize on this event. Accordingly, it is hardly possible to say that there was a definite market reaction to the report.
As for trading signals, everything here is outrageously simple. Since the price spent most of the day near the range indicated above, only one signal was formed - when the price settled above it. However, it was also extremely difficult to identify this signal, since the flat remained the whole day. Thus, if traders nevertheless saw this signal and worked it out, they could earn a couple of tens of points. If not, then they simply did not receive any profit or loss.
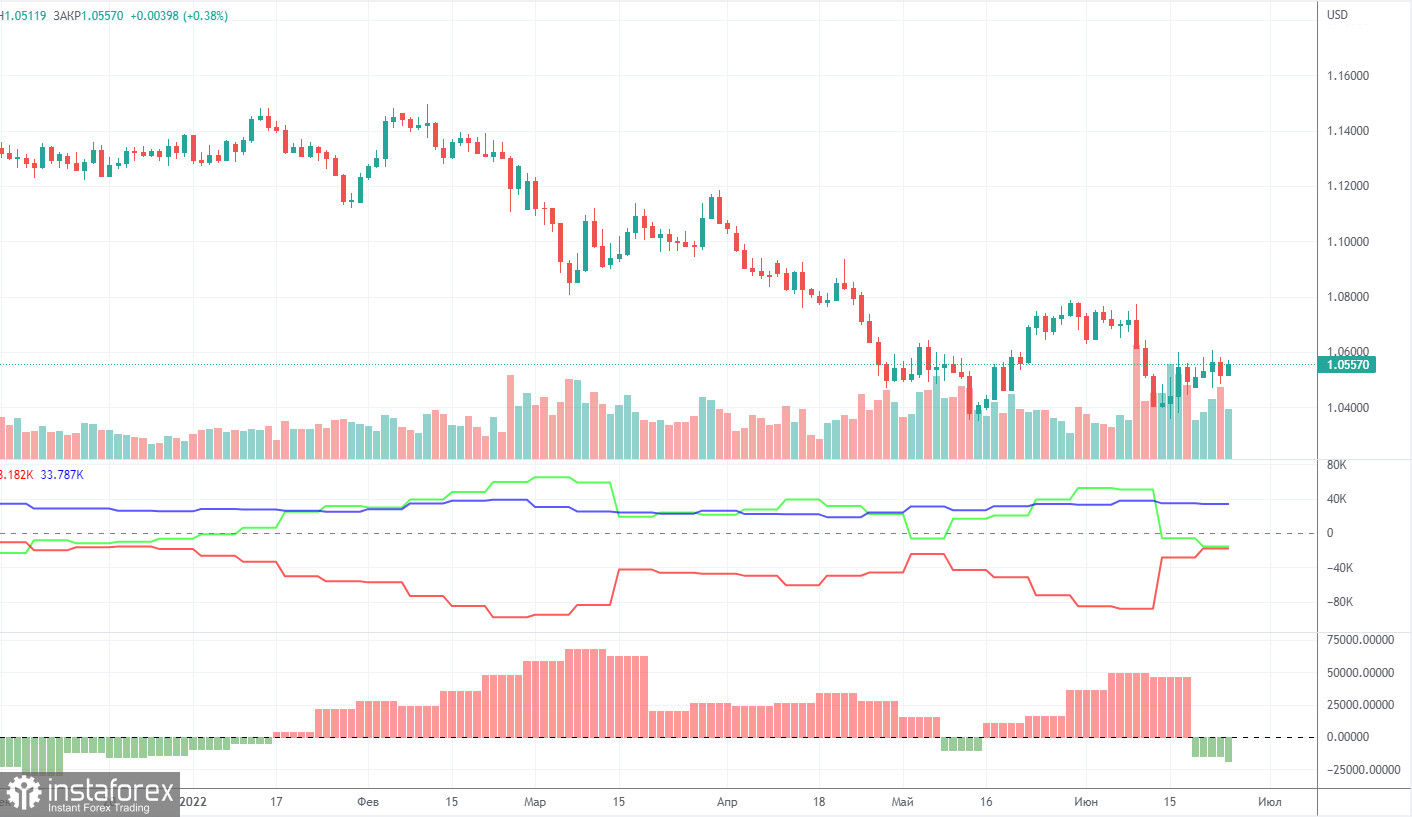
The latest Commitment of Traders (COT) reports on the euro caused a huge number of questions. Recall that in the past few months, they showed a blatant bullish mood of professional players, but the euro fell all the time. At this time, the situation is beginning to change, and again, not in favor of the euro. If earlier the mood was bullish, but the euro was falling, now the mood has become bearish... So what can we expect from the euro in this case? The question is rhetorical. During the reporting week, the number of long positions decreased by 11,400, and the number of shorts positions in the non-commercial group decreased by 1,800. Thus, the net position fell again, this time by almost 10,000 contracts. From our point of view, this fact very eloquently indicates that now even major players do not believe in the euro. The number of longs is now lower than the number of shorts for non-commercial traders by 16,000. Therefore, we can state that now not only the demand for the US dollar remains high, but also the demand for the euro is gradually declining. This may lead to a new, even greater fall of the euro. In principle, over the past few months or even more, the euro has not been able to show even a strong correction, not to mention something more. Its highest upward movement was about 400 points. All fundamental, geopolitical factors remain in favor of the US dollar.
Overview of the EUR/USD pair. June 28. Christine Lagarde will speak every day, and inflation will continue to rise in the European Union.
Overview of the GBP/USD pair. June 28. The British pound completely repeats the trajectory of the euro.
Forecast and trading signals for GBP/USD on June 28. Detailed analysis of the movement of the pair and trading transactions.
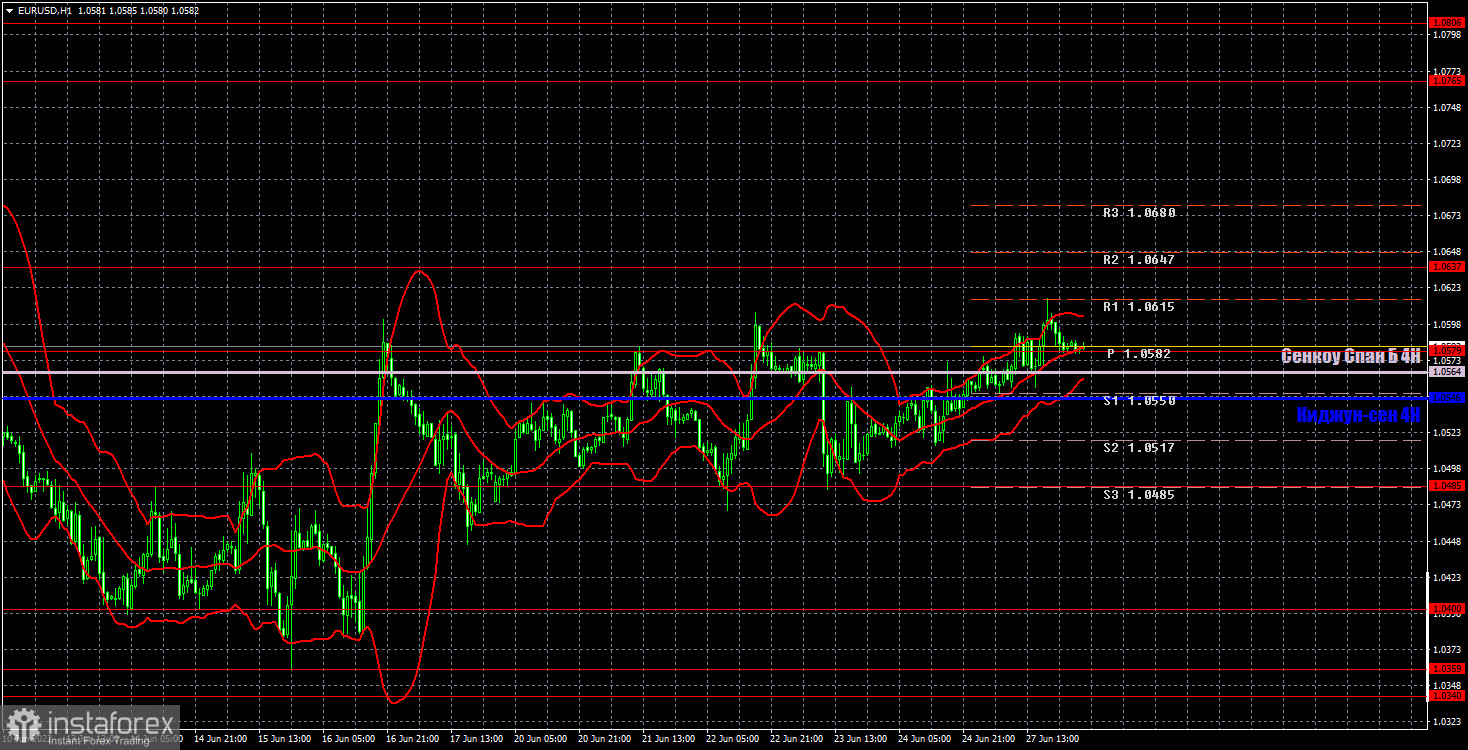
It is clearly seen on the hourly timeframe that the pair began to make attempts to continue the upward movement. We said in recent articles that such an option is possible, but we still do not expect anything special from the euro. Corrective growth may continue, but it is unlikely that the euro will be able to show impressive growth. Today, we highlight the following levels for trading - 1.0340-1.0359, 1.0400, 1.0485, 1.0579, 1.0637, as well as Senkou Span B (1.0564) and Kijun-sen (1 .0546). Ichimoku indicator lines can move during the day, which should be taken into account when determining trading signals. There are also secondary support and resistance levels, but no signals are formed near them. Signals can be "rebounds" and "breakthrough" extreme levels and lines. Do not forget about placing a Stop Loss order at breakeven if the price has gone in the right direction for 15 points. This will protect you against possible losses if the signal turns out to be false. European Central Bank President Christine Lagarde will speak in Europe, but nothing in the US. Since Lagarde will speak four times this week, we definitely do not expect new and important information from each speech.
Support and Resistance Levels are the levels that serve as targets when buying or selling the pair. You can place Take Profit near these levels.
Kijun-sen and Senkou Span B lines are lines of the Ichimoku indicator transferred to the hourly timeframe from the 4-hour one.
Support and resistance areas are areas from which the price has repeatedly rebounded off.
Yellow lines are trend lines, trend channels and any other technical patterns.
Indicator 1 on the COT charts is the size of the net position of each category of traders.
Indicator 2 on the COT charts is the size of the net position for the non-commercial group.
InstaForex analytical reviews will make you fully aware of market trends! Being an InstaForex client, you are provided with a large number of free services for efficient trading.

