 Stay
Stay 
Trading Conditions
Products
Tools


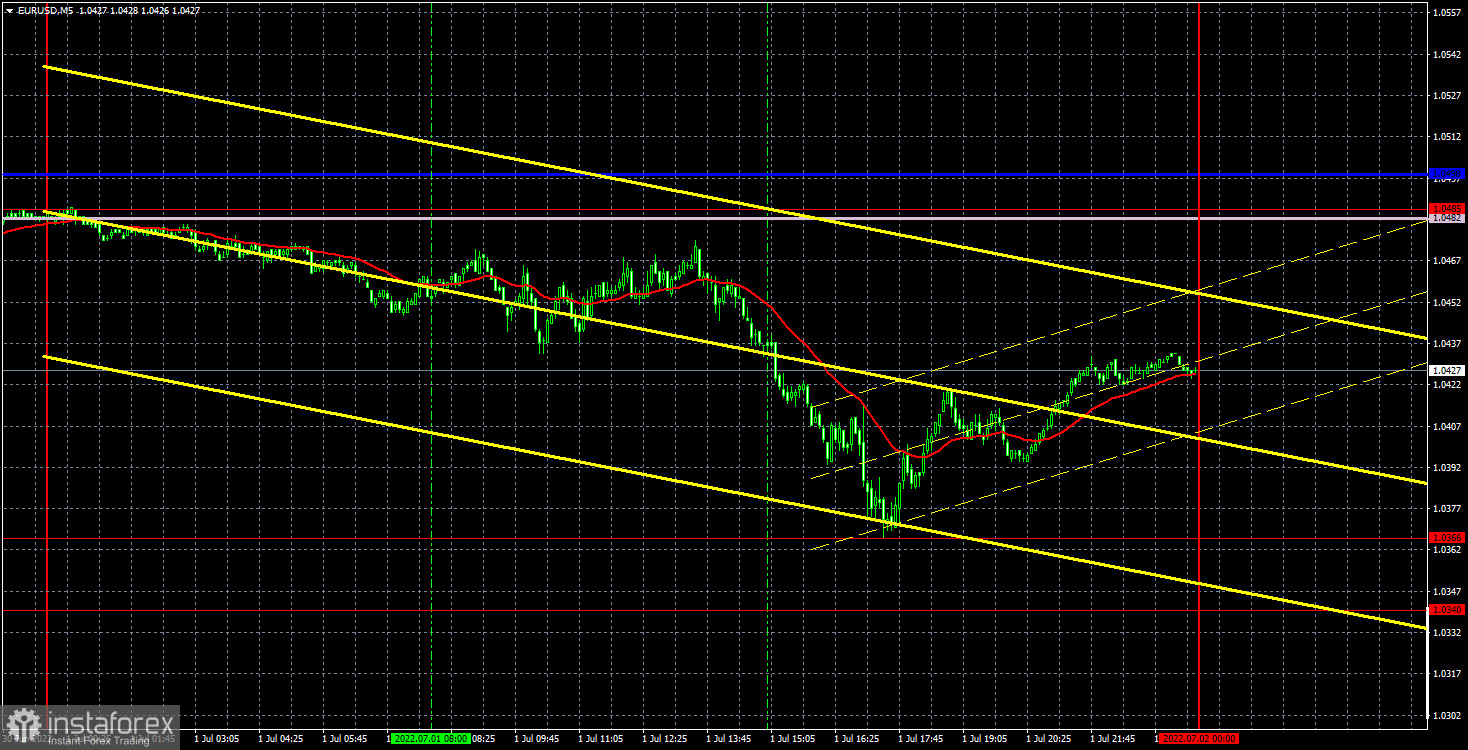
Last Friday, the EUR/USD pair significantly fell during the day. The fall was at least 100 points and it happened approximately after the European inflation report was published. Recall that the consumer price index in the European Union continued to grow (what a surprise!) and now stands at 8.6% Y/Y. No one has any reason to expect a slowdown in inflation, except for European Central Bank President Christine Lagarde, who continues to believe that prices will stop rising by themselves. In the meantime, the ECB continues to wait, the market will continue to get rid of the euro. We have already said that, in fact, rising inflation should mean an increase in the likelihood of monetary tightening and support for the euro. But in the European Union, it's the opposite. An increase in inflation simply means an increase in inflation, that is, a negative process in which money depreciates. Therefore, the euro is falling and is still trading near its 20-year lows. In fairness, it should be noted that so far it has not been able to update them. On Friday, the decline ended near the 1.0366 level, just 26 points from the record low.
As for trading signals, none of them were formed on Friday. The pair approached the Senkou Span B line several times, but never worked it out. And the level of 1.0366, from which a rebound was made, was a new level and did not take part in Friday's auctions.
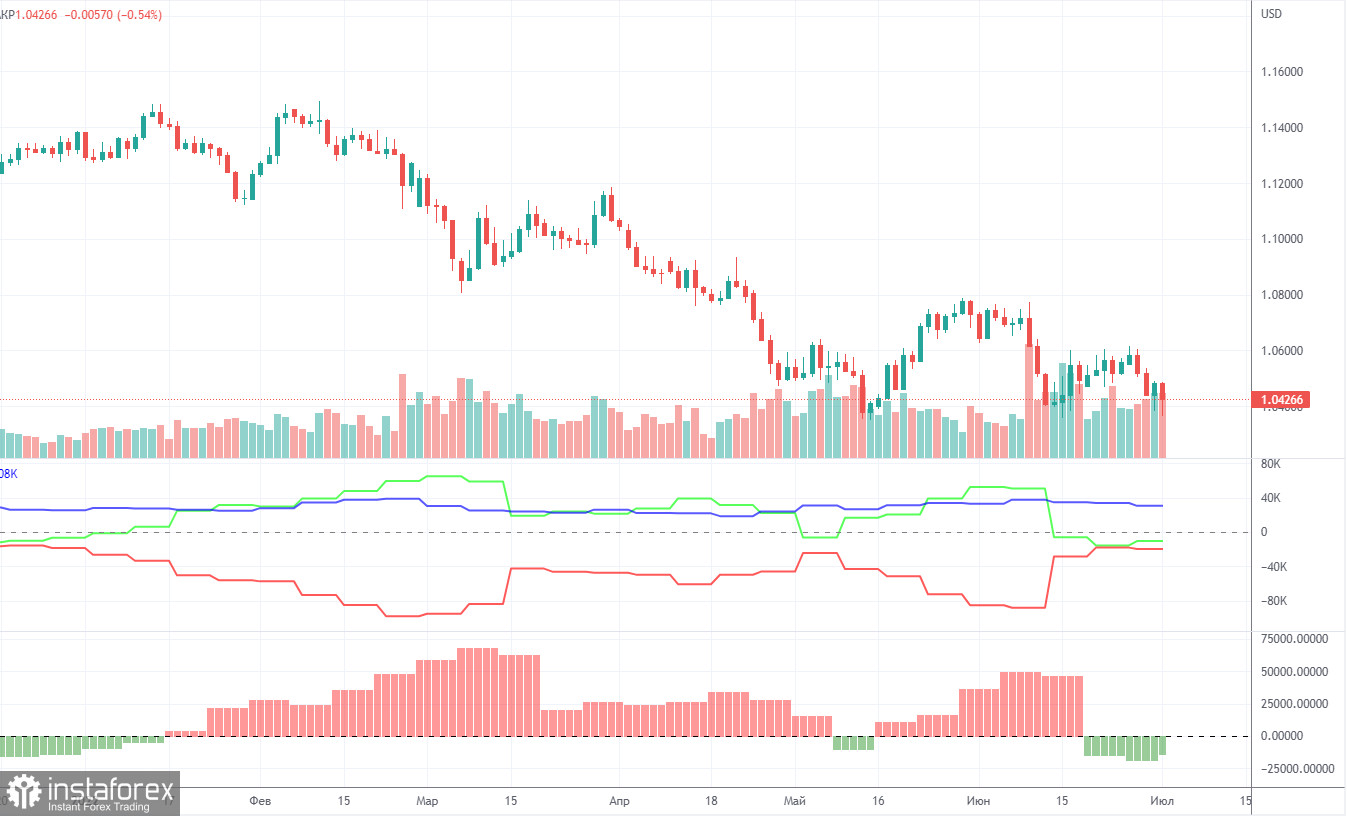
The latest Commitment of Traders (COT) reports on the euro over the past six months have raised a huge number of questions. The chart above clearly shows that they showed a blatant bullish mood of professional players, but at the same time, the euro was falling at the same time. At this time, the situation has changed a bit, and not in favor of the euro. If earlier the mood was bullish, but the euro was falling, now the mood has become bearish and... the euro is falling. Therefore, for the time being, we do not see any grounds for the euro's growth, because the vast majority of factors remain against it. During the reporting week, the number of long positions decreased by 6,100, and the number of shorts in the non-commercial group decreased by 11,100. Accordingly, the net position slightly increased by 5,000 contracts. However, the mood of major players still remains bearish. From our point of view, this fact very eloquently indicates that at this time even professional traders do not believe in the euro. The number of longs is lower than the number of shorts for non-commercial traders by 11,000. Therefore, we can state that not only the demand for the US dollar remains high, but also the demand for the euro is quite low. This may lead to a new, even greater fall of the euro. In principle, over the past few months or even more, the euro has not been able to show even a tangible correction, not to mention something more. The highest upward movement was about 400 points.
Overview of the EUR/USD pair. July 4. The euro will celebrate the US Independence Day near its 20-year lows.
Overview of the GBP/USD pair. July 4. What does the NonFarm Payrolls report prepare for us?
Forecast and trading signals for GBP/USD on July 4. Detailed analysis of the movement of the pair and trading transactions.
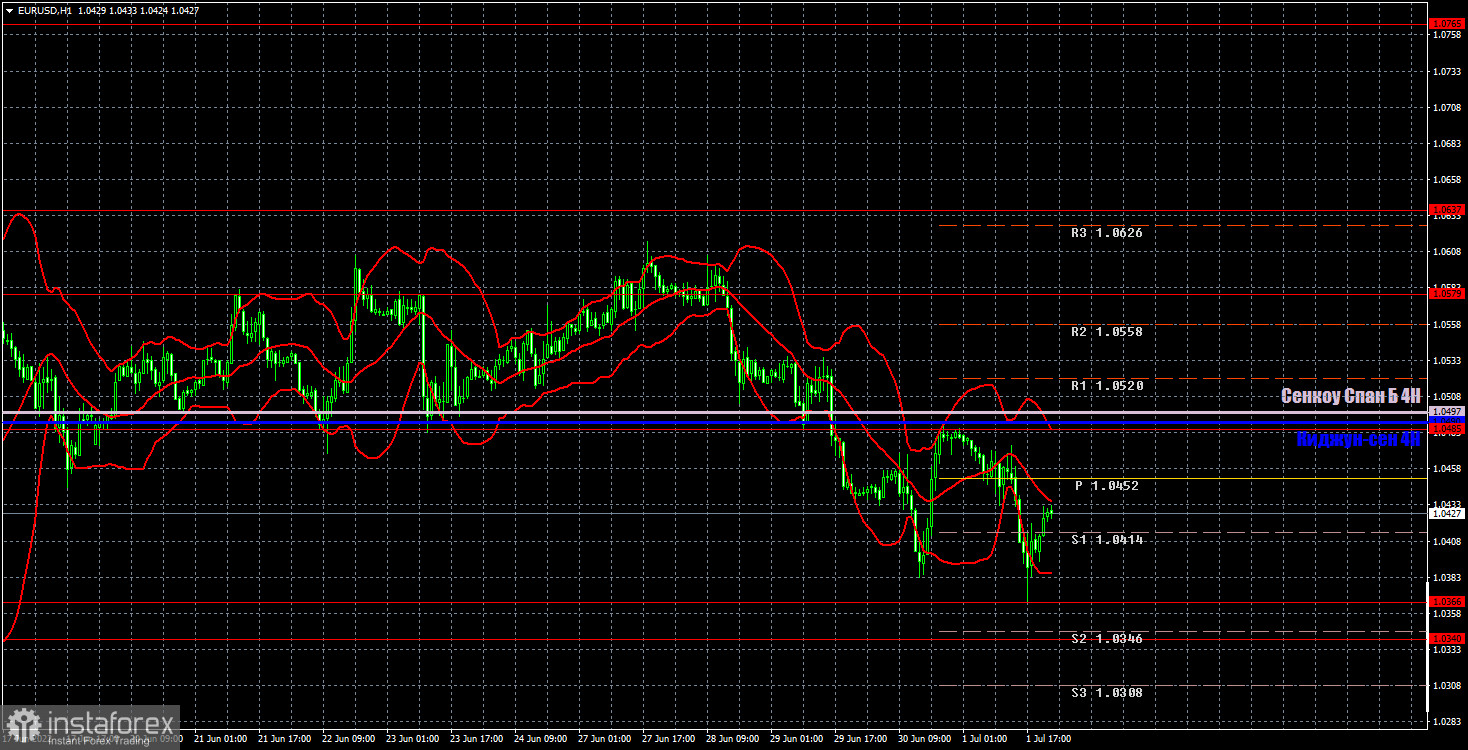
It is clearly seen on the hourly timeframe that the pair has again settled below all lines of the Ichimoku indicator. Thus, the trend is now down again, and only the very 20-year low, near which the bears are afraid to open new short positions, saves the euro from further falling. But if the situation with the fundamental and geopolitical background does not change, then, most likely, the renewal of these lows is just a matter of time. On Monday, we allocate the following levels for trading - 1.0340-1.0366, 1.0485, 1.0579, 1.0637, as well as Senkou Span B (1.0497) and Kijun-sen (1.0490). Ichimoku indicator lines can move during the day, which should be taken into account when determining trading signals. There are also secondary support and resistance levels, but no signals are formed near them. Signals can be "rebounds" and "breakthrough" extreme levels and lines. Do not forget about placing a Stop Loss order at breakeven if the price has gone in the right direction for 15 points. This will protect you against possible losses if the signal turns out to be false. Not a single important and interesting event is planned in Europe and the United States. Today is Independence Day in the United States, so American sites and banks will be closed. Therefore, we can expect a serious drop in the pair's volatility.
Support and Resistance Levels are the levels that serve as targets when buying or selling the pair. You can place Take Profit near these levels.
Kijun-sen and Senkou Span B lines are lines of the Ichimoku indicator transferred to the hourly timeframe from the 4-hour one.
Support and resistance areas are areas from which the price has repeatedly rebounded off.
Yellow lines are trend lines, trend channels and any other technical patterns.
Indicator 1 on the COT charts is the size of the net position of each category of traders.
Indicator 2 on the COT charts is the size of the net position for the non-commercial group.
InstaForex analytical reviews will make you fully aware of market trends! Being an InstaForex client, you are provided with a large number of free services for efficient trading.

