 Stay
Stay 
Trading Conditions
Products
Tools


The index of business activity in the EU manufacturing sector fell from 54.6 to 52.1. Whereas the preliminary estimate showed its decline to 52.0.
There was no reaction from the euro to the statistics.
A similar indicator in the UK came out much worse than the preliminary estimate. The index was expected to drop from 54.6 to 53.4, but actual data came out at 52.8.
The market reaction to the statistical data was negative, the pound sterling went down.
At 09:00 UTC, preliminary data on inflation in Europe were published, which was expected to accelerate from 8.1% to 8.3%. Actual data showed that inflation not only broke the historical record but went even further to the level of 8.6%.
Thus, inflationary pressure is increased by unrest within the EU economy, which has led to a sell-off of the euro. It is worth noting that the subsequent rise in inflation once again indicates the possibility of an early increase in the ECB interest rate, which should take place during the upcoming meeting of the regulator's board.
During the American trading session, the index of business activity in the manufacturing sector was published, which fell from 56.1 to 53.0, while the forecast was 54.9 points.
A stronger decline in the index provoked traders to fix dollar positions, which led to a pullback.
The EURUSD currency pair, during an intensive downward movement, has come close to the bottom of the downward trend. As a result, there was a reduction in the volume of short positions, which led to a slowdown in the downward cycle, resulting in a price pullback.
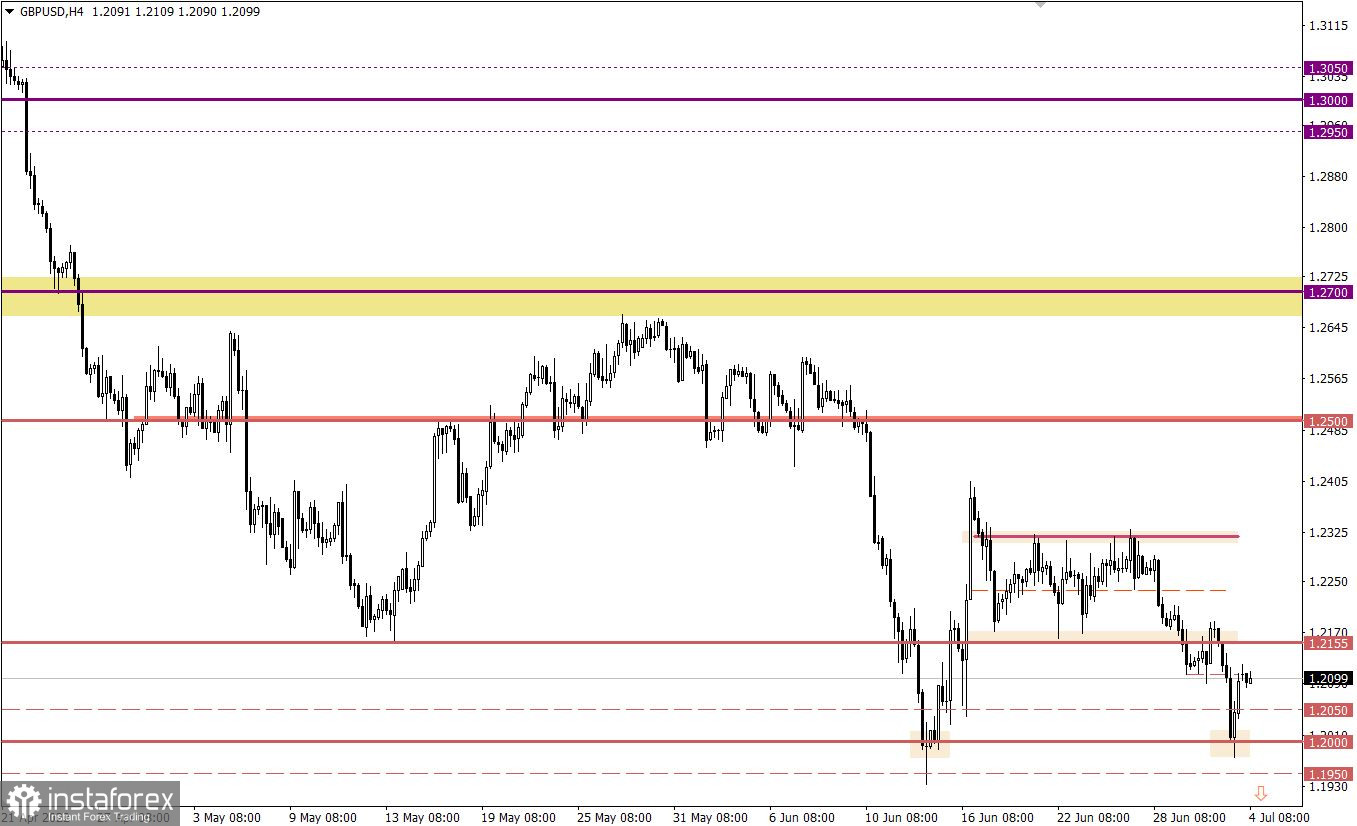
The GBPUSD currency pair rebounded from the psychologically important level of 1.2000 with surgical precision. This move was accompanied by a sharp change in trading interests, reducing the volume of short positions and increasing the volume of long positions.

Today is an official holiday in the United States on the occasion of the celebration of Independence Day. Thus, banks, exchanges, funds, and companies do not work, which will lead to a decrease in trading volumes on the market.
The price area of 1.0320/1.0350 serves as a support on the sellers' path, near which traders feel pressure on short positions. It is possible to assume a subsequent fluctuation within the support accompanied by technical pullbacks. The breakdown scenario will be relevant only after the price is kept below the value of 1.0320, at least in a four-hour period.
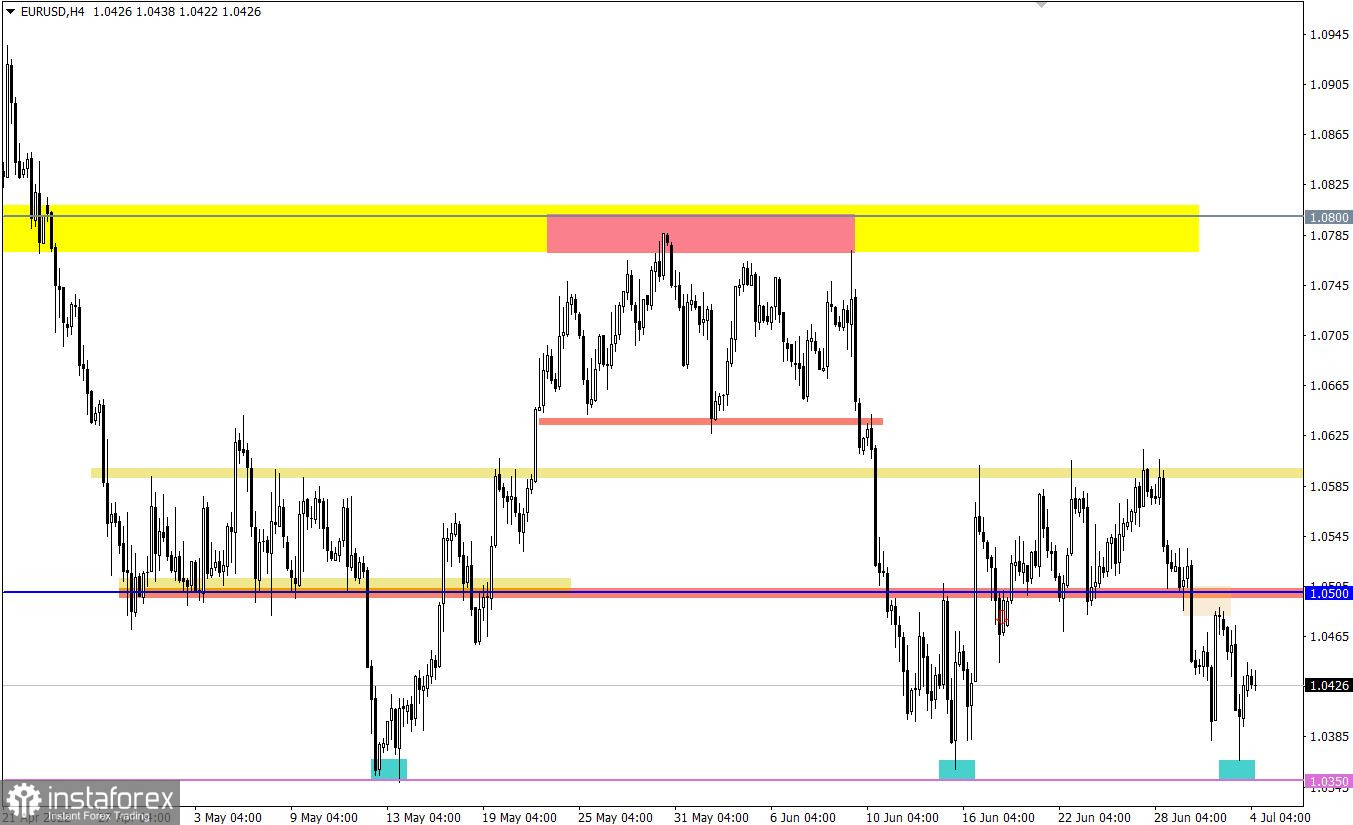
In this situation, a technical price rebound could serve as a regrouping of trading forces, which would subsequently strengthen the downward movement. The main sell signal will appear on the market only after the price holds below 1.1950 for at least a four-hour period. In this case, the medium-term downward trend will be prolonged to new price levels. Until then, fluctuations are not excluded.
A candlestick chart view is graphical rectangles of white and black light, with sticks on top and bottom. When analyzing each candle in detail, you will see its characteristics of a relative period: the opening price, closing price, and maximum and minimum prices.
Horizontal levels are price coordinates, relative to which a stop or a price reversal may occur. These levels are called support and resistance in the market.
Circles and rectangles are highlighted examples where the price of the story unfolded. This color selection indicates horizontal lines that may put pressure on the quote in the future.
The up/down arrows are the reference points of the possible price direction in the future.
InstaForex analytical reviews will make you fully aware of market trends! Being an InstaForex client, you are provided with a large number of free services for efficient trading.


