 Stay
Stay 
Trading Conditions
Products
Tools


The GBP/USD currency pair collapsed as strongly and just as unreasonably as the EUR/USD pair on Tuesday. We cannot say that such a movement came as a complete surprise to us, but we still did not expect it on Tuesday, the day after Independence Day in the United States. As already mentioned, there were no reasons for such a strong growth of the US currency. During the past day, there was not a single important publication or event that even theoretically could provoke such a movement. However, the pound has shown absolute passivity and unwillingness to grow over the past few weeks. Thus, its final fall was only a matter of time. We expected that it could happen against the backdrop of the next Federal Reserve rate hike of 0.75%, but it ended up happening earlier. The only report of the day - the index of business activity in the UK services sector - did not matter, and it certainly did not provoke a collapse in the foreign exchange market.
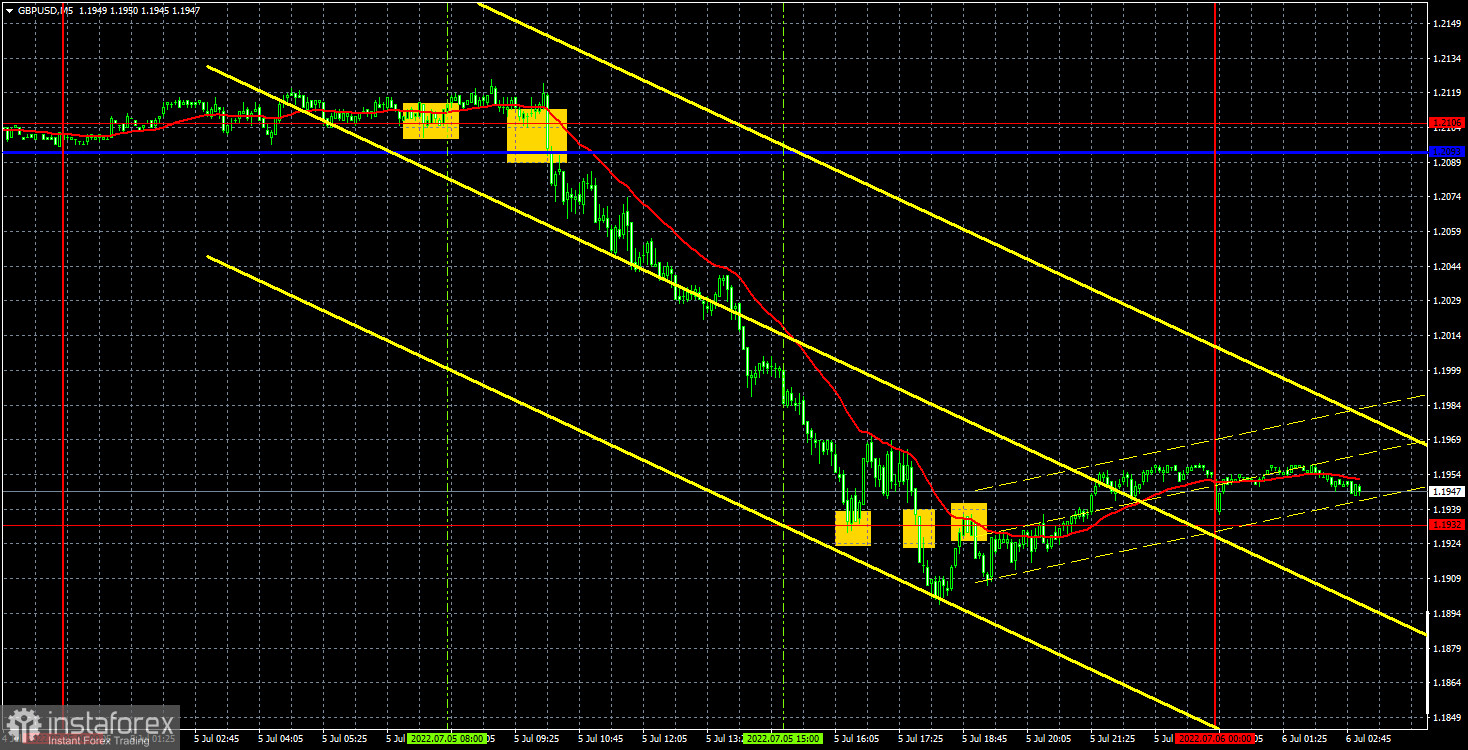
Everything was just fine with trading signals for the pound too. At first, a false buy signal was formed when the price rebounded at the opening of the European session from the extreme level of 1.2106, but the next sell signal offset the losses on the first deal and made it possible to make very good money. The pair eventually fell to the nearest level of 1.1932, profit on a short position amounted to at least 135 points. It was also possible to work out a buy signal formed near the same level. However, it turned out to be false, but the Stop Loss set to breakeven worked on it (the price moved in the right direction for 20 points). The next sell signal could also be worked out, but it was also closed by Stop Loss at breakeven, since in this case the pair went in the right direction for 20 points.
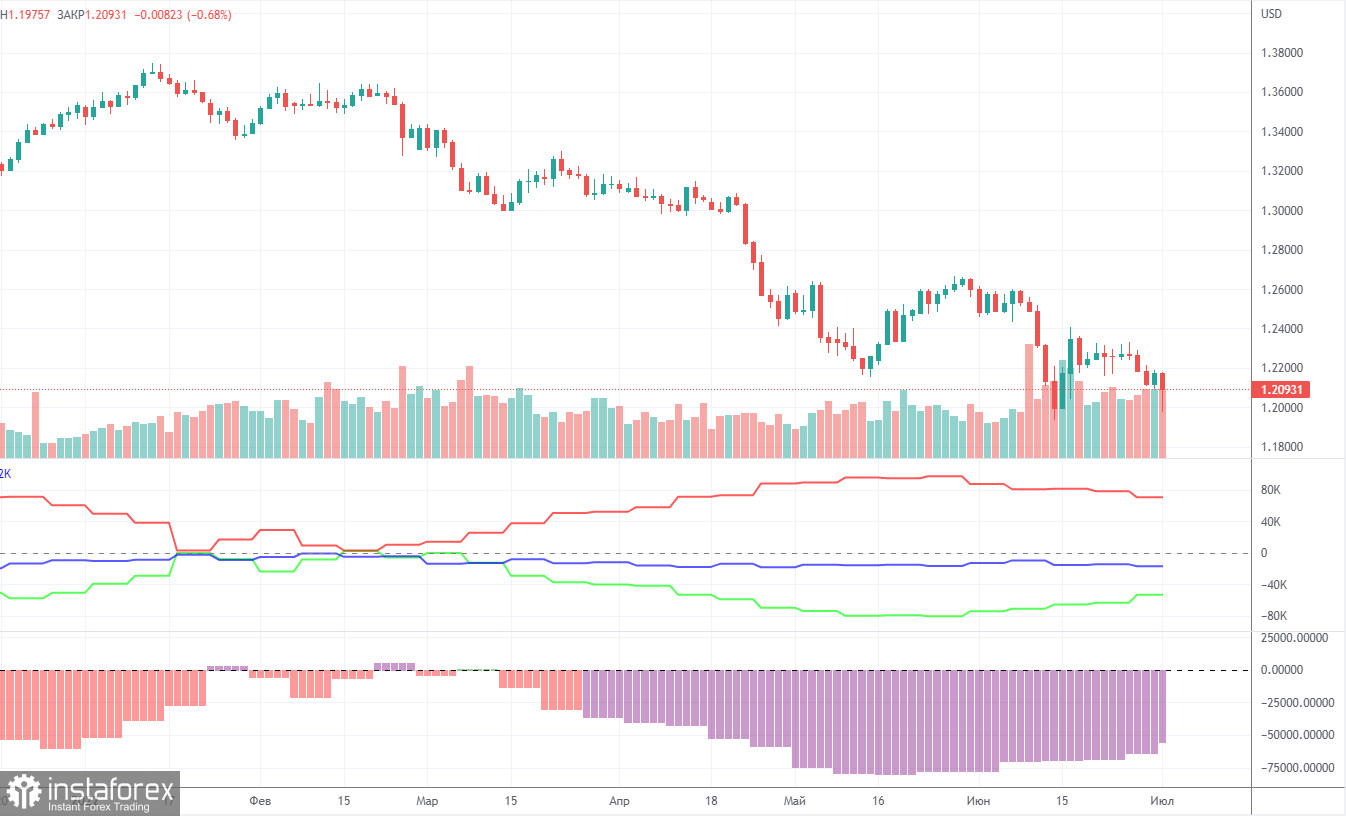
The latest Commitment of Traders (COT) report again showed insignificant changes. During the week, the non-commercial group opened 6,700 long positions and closed 3,400 short positions. Thus, the net position of non-commercial traders increased by 10,000. However, the mood of major players still remains "pronounced bearish", which is clearly seen from the second indicator in the chart above. And the pound, despite the increase in the net position, still cannot show even a tangible upward correction. The net position has been falling for three months, now it is rising, but what difference does it make if the British currency is depreciating anyway? We have already said that the COT reports for the pound do not take into account the demand for the dollar, which is likely to remain very high right now. Consequently, even for the strengthening of the British currency, it is required that demand for it grows faster and stronger than demand for the dollar. The non-commercial group currently has a total of 88,000 short positions open and only 35,000 longs. The net position will have to show growth for a long time to at least equalize these figures. Neither macroeconomic statistics nor fundamental events support the UK currency. As before, we can only count on corrective growth, but we believe that the pound will continue to fall in the medium term.
Overview of the EUR/USD pair. July 6. It has happened: the euro has updated its 20-year lows.
Overview of the GBP/USD pair. July 6. Finland could become a new hotbed of conflict in Europe.
Forecast and trading signals for GBP/USD on July 6. Detailed analysis of the movement of the pair and trading transactions.
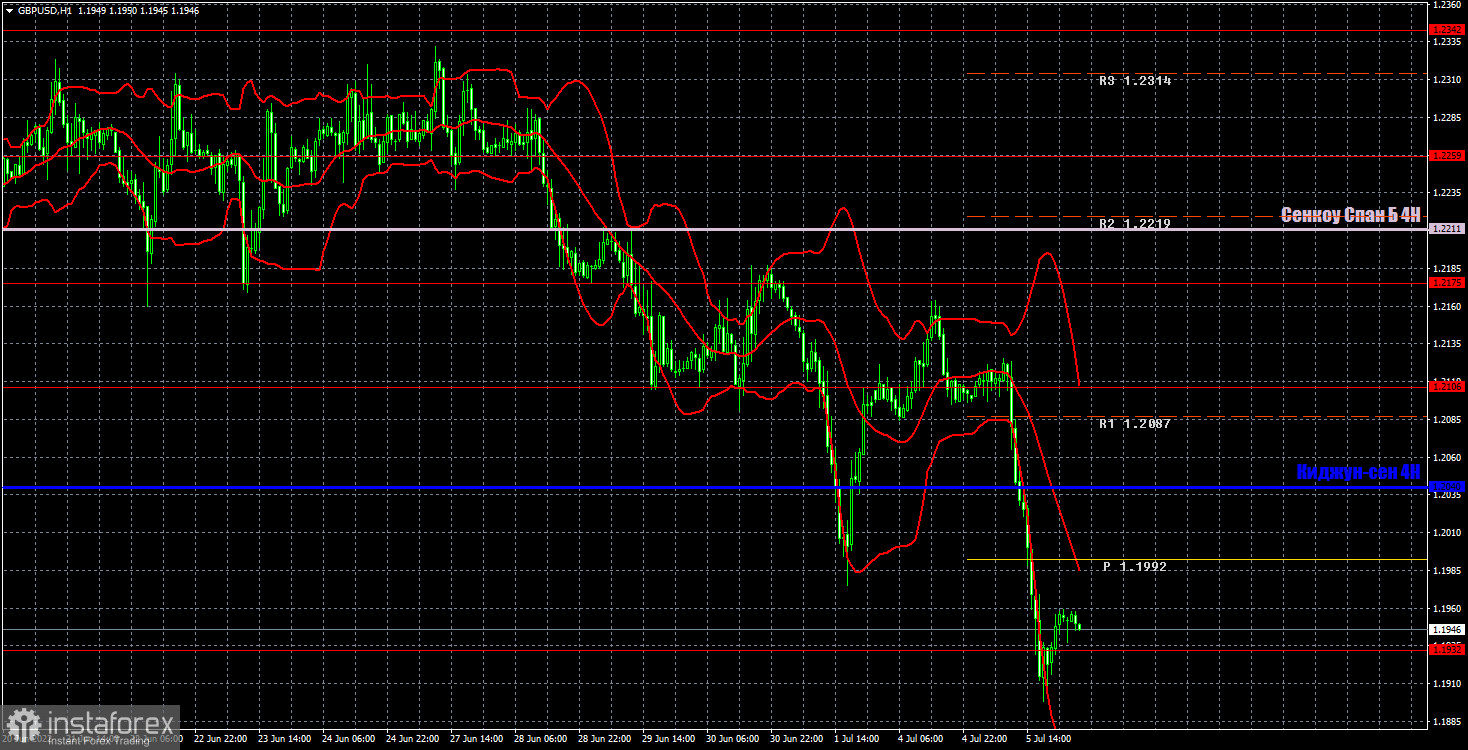
The quotes of the British pound made an impressive collapse on the hourly timeframe, which fully fits into the current technical picture. It is quite difficult to predict what will happen today. It would be logical to see an upward correction, but when the market starts mass shorts like this, practically from scratch, it can take several days. We highlight the following important levels on Wednesday: 1.1932, 1.2106, 1.2175, 1.2259. Senkou Span B (1.2211) and Kijun-sen (1.2040) lines can also be sources of signals. Signals can be "rebounds" and "breakthroughs" of these levels and lines. The Stop Loss level is recommended to be set to breakeven when the price passes in the right direction by 20 points. Ichimoku indicator lines can move during the day, which should be taken into account when determining trading signals. The chart also contains support and resistance levels that can be used to take profits on trades. The report on business activity in the construction sector is scheduled for Wednesday in the UK, and the ISM index for the service sector is scheduled for the US. The US ISM has enough weight to provoke a market reaction, but it needs to be very different from the forecast.
Support and Resistance Levels are the levels that serve as targets when buying or selling the pair. You can place Take Profit near these levels.
Kijun-sen and Senkou Span B lines are lines of the Ichimoku indicator transferred to the hourly timeframe from the 4-hour one.
Support and resistance areas are areas from which the price has repeatedly rebounded off.
Yellow lines are trend lines, trend channels and any other technical patterns.
Indicator 1 on the COT charts is the size of the net position of each category of traders.
Indicator 2 on the COT charts is the size of the net position for the non-commercial group.
InstaForex analytical reviews will make you fully aware of market trends! Being an InstaForex client, you are provided with a large number of free services for efficient trading.


