 Stay
Stay 
Trading Conditions
Products
Tools


The GBP/USD currency pair also continued its upward movement on Tuesday, although there were absolutely no reasons or grounds for this. We would even say the opposite, there were grounds for the pound's fall, since the macroeconomic statistics from Great Britain were not the most rosy. If the unemployment rate has not changed over the month, then wages have grown much weaker than experts' forecasts. However, these reports still do not have such weight in the eyes of traders as, for example, the inflation report, which will be published today. Therefore, we can conclude that the current growth of the British pound is purely technical. One way or another, the pound has also been growing for the fourth consecutive day, so we can talk about a new upward trend, albeit a short-term one. But now even such a trend is a source of happiness for European currencies. Now we wait until Thursday and see if the pound will fall if the euro begins to fall after the announcement of the results of the European Central Bank meeting? After all, the monetary policy of the ECB has nothing to do with the pound.
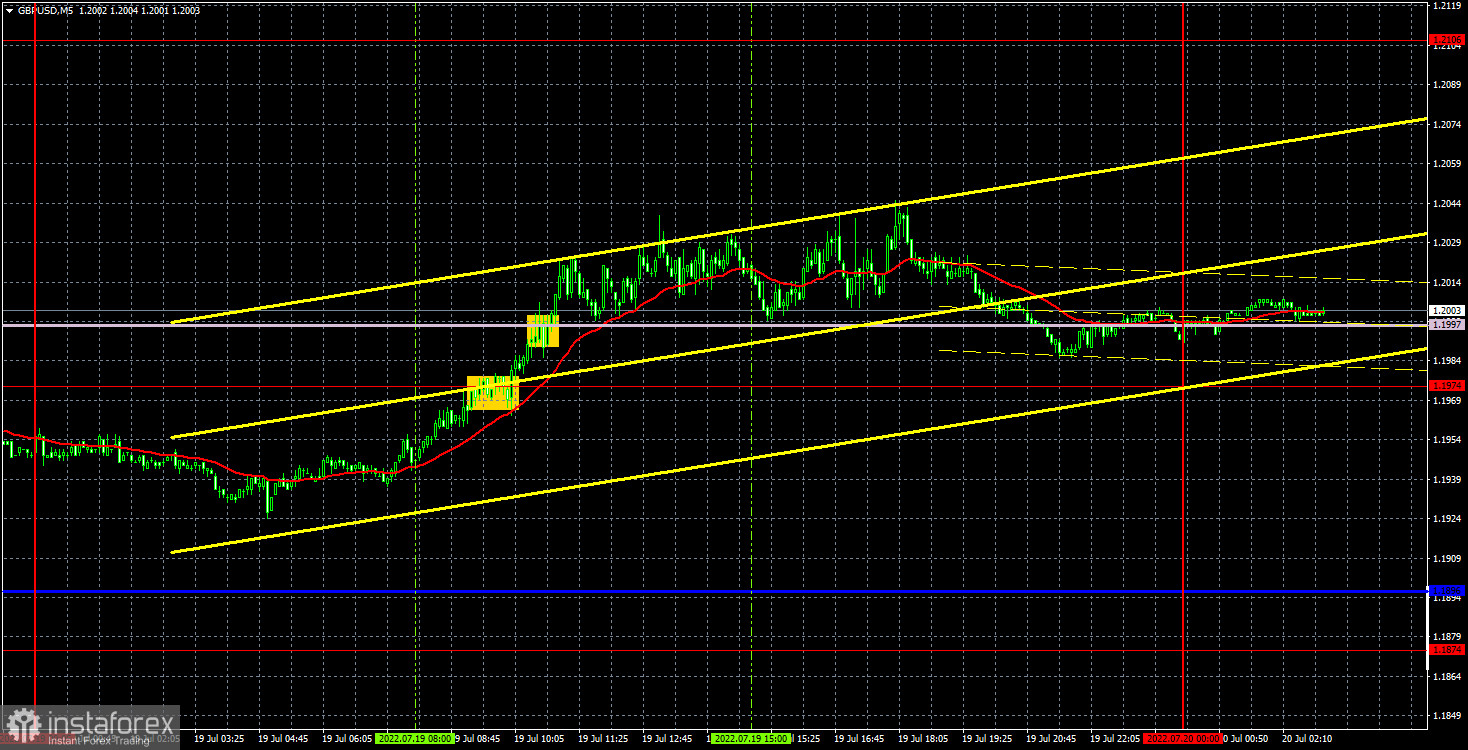
There were few trading signals on Tuesday, but so many are better than zero, as for the euro/dollar pair. The first buy signal was formed when the extreme level of 1.1974 was overcome, and the second - literally half an hour later, when the Senkou Span B line was overcome. The pair formally settled above the Ichimoku cloud, although this consolidation cannot be called certain yet. Nevertheless, long positions should have been opened on the first signal, and they should have been kept open on the second signal. Not a single signal to sell was formed until the evening, so the deal had to be closed manually in the late afternoon. Profit on it amounted to about 35 points.
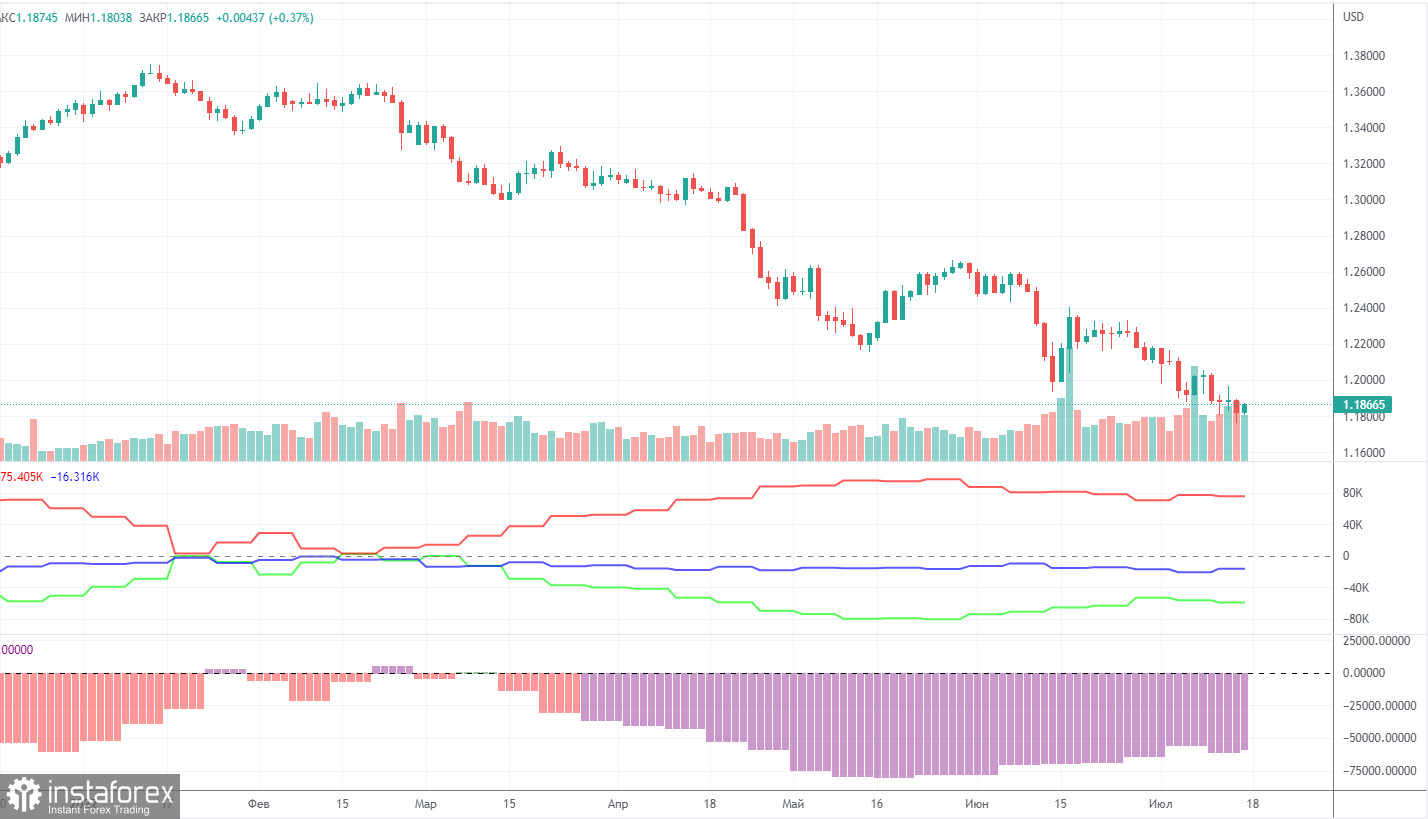
The latest Commitment of Traders (COT) report on the British pound again showed insignificant changes. During the week, the non-commercial group closed 5,700 longs and 2,800 shorts. Thus, the net position of non-commercial traders increased by 2,900. But what does it matter if the mood of the big players still remains "pronounced bearish", which is clearly seen in the second indicator in the chart above? And the pound, in spite of everything, still cannot show even a tangible upward correction? The net position fell for three months, then grew for some time, but what's the difference if the British currency still continues to depreciate against the US dollar? We have already said that the COT reports do not take into account the demand for the dollar, which is probably still very high right now. Therefore, even for the strengthening of the British currency, the demand for it must grow faster and stronger than the demand for the dollar. The non-commercial group currently has a total of 93,000 shorts open and only 34,000 longs. The net position will have to show growth for a long time to at least equalize these figures. Neither macroeconomic statistics nor fundamental events support the UK currency. As before, we can only count on corrective growth, but we believe that in the medium term, the pound will continue to fall.
Overview of the EUR/USD pair. July 20. The time has come for the ECB to take the inflation problem seriously.
Overview of the GBP/USD pair. July 20. Election of the prime minister of Great Britain: four candidates remain.
Forecast and trading signals for EUR/USD on July 20. Detailed analysis of the movement of the pair and trading transactions.
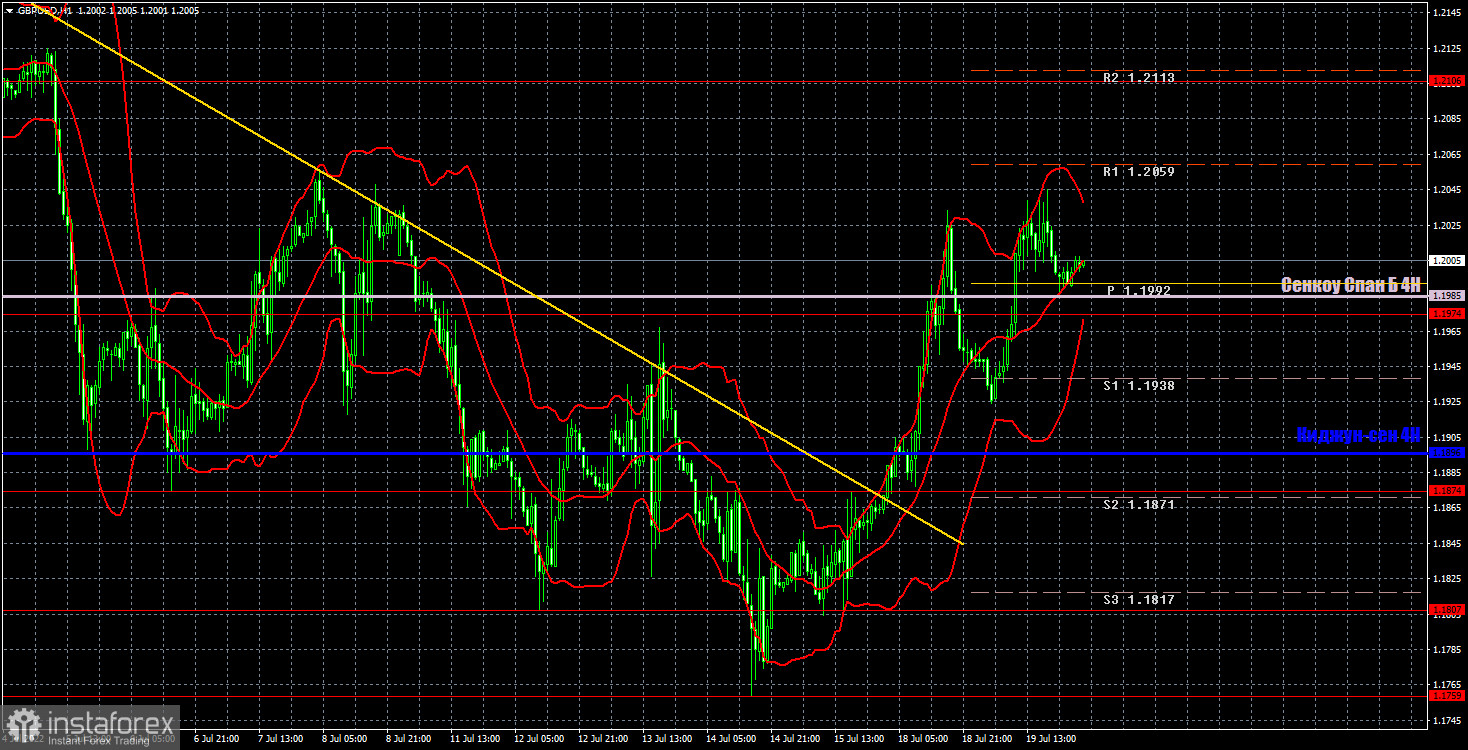
The pound has overcome both the descending trend line and the Senkou Span B line on the hourly timeframe. Thus, the short-term growth of the British currency can formally continue now, if the fundamental and geopolitical backgrounds did not remain entirely on the dollar's side. However, it will not bury the pound ahead of time. Still, it clearly deserved a two-three-week correction. For July 20, we highlight the following important levels: 1.1807, 1.1874, 1.1974, 1.2106, 1.2175. The Senkou Span B (1.1985) and Kijun-sen (1.1896) lines can also be sources of signals. Signals can be "rebounds" and "breakthrough" of these levels and lines. The Stop Loss level is recommended to be set to breakeven when the price passes in the right direction by 20 points. Ichimoku indicator lines can move during the day, which should be taken into account when determining trading signals. The chart also contains support and resistance levels that can be used to take profits on trades. The UK is set to publish a report on inflation, and there is absolutely nothing in the US. Therefore, traders will focus on a single report. However, do not forget that now the euro and the pound are also rising due to the need to correct, so whatever the inflation report, the pound may continue to grow.
Support and Resistance Levels are the levels that serve as targets when buying or selling the pair. You can place Take Profit near these levels.
Kijun-sen and Senkou Span B lines are lines of the Ichimoku indicator transferred to the hourly timeframe from the 4-hour one.
Support and resistance areas are areas from which the price has repeatedly rebounded off.
Yellow lines are trend lines, trend channels and any other technical patterns.
Indicator 1 on the COT charts is the size of the net position of each category of traders.
Indicator 2 on the COT charts is the size of the net position for the non-commercial group.
InstaForex analytical reviews will make you fully aware of market trends! Being an InstaForex client, you are provided with a large number of free services for efficient trading.


