 Stay
Stay 
Trading Conditions
Products
Tools


Trend analysis (fig. 1).
On Thursday, the pair may edge higher from the level of 1.1969 (the closing of yesterday's daily candlestick) to the target level of 1.2029 - the 21-day EMA (black thin line). After testing this level, the price could advance to 1.2112, the Fibonacci retracement level of 61.8% (red dotted line). Shortly after, the price is likely to decline.
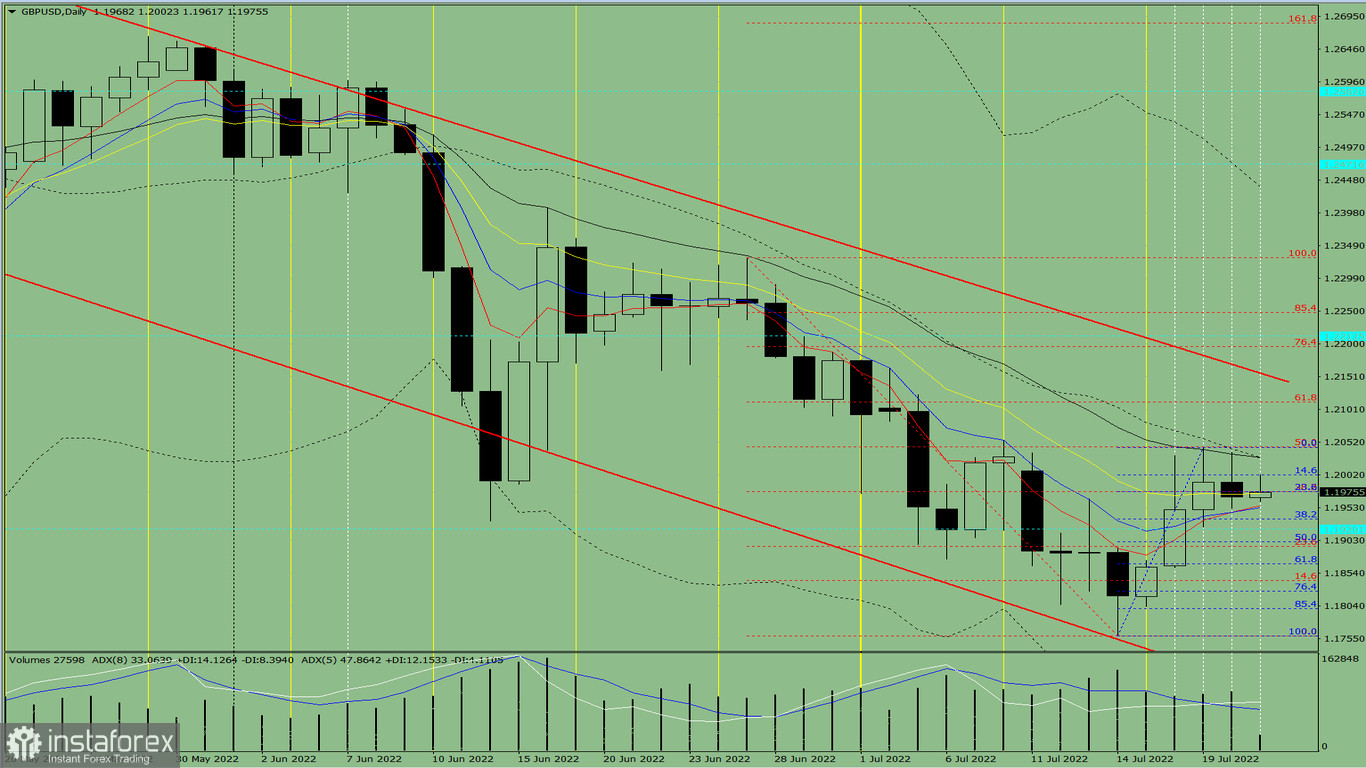
Fig. 1 (daily chart).
Complex analysis:
- indicator analysis– up;- Fibonacci retracement levels – up;- trading volumes – up;- candlestick analysis – up;- trend analysis – up;- Bollinger bands – down;- weekly chart-up.
Conclusion:
Today, the pair may edge higher from the level of 1.1969 (the closing of yesterday's daily candlestick) to the target level of 1.2029 – the 21-day EMA (black thin line). After testing this level, the price could advance to 1.2112, the Fibonacci retracement level of 61.8% (red dotted line). Shortly after, the price is likely to decline.
Alternatively, the price could also continue to rise from the level of 1.1969 (the closing of yesterday's daily candlestick) to 1.2002, the Fibonacci retracement level of 14.6% (blue dotted line). After testing this level, a downward reversal may take place. If so, the price will drop to 1.1935 – the Fibonacci retracement level of 38.2% (blue dotted line). After reaching this level, the pair is likely to make an upward reversal.
InstaForex analytical reviews will make you fully aware of market trends! Being an InstaForex client, you are provided with a large number of free services for efficient trading.


