 Stay
Stay 
Trading Conditions
Products
Tools


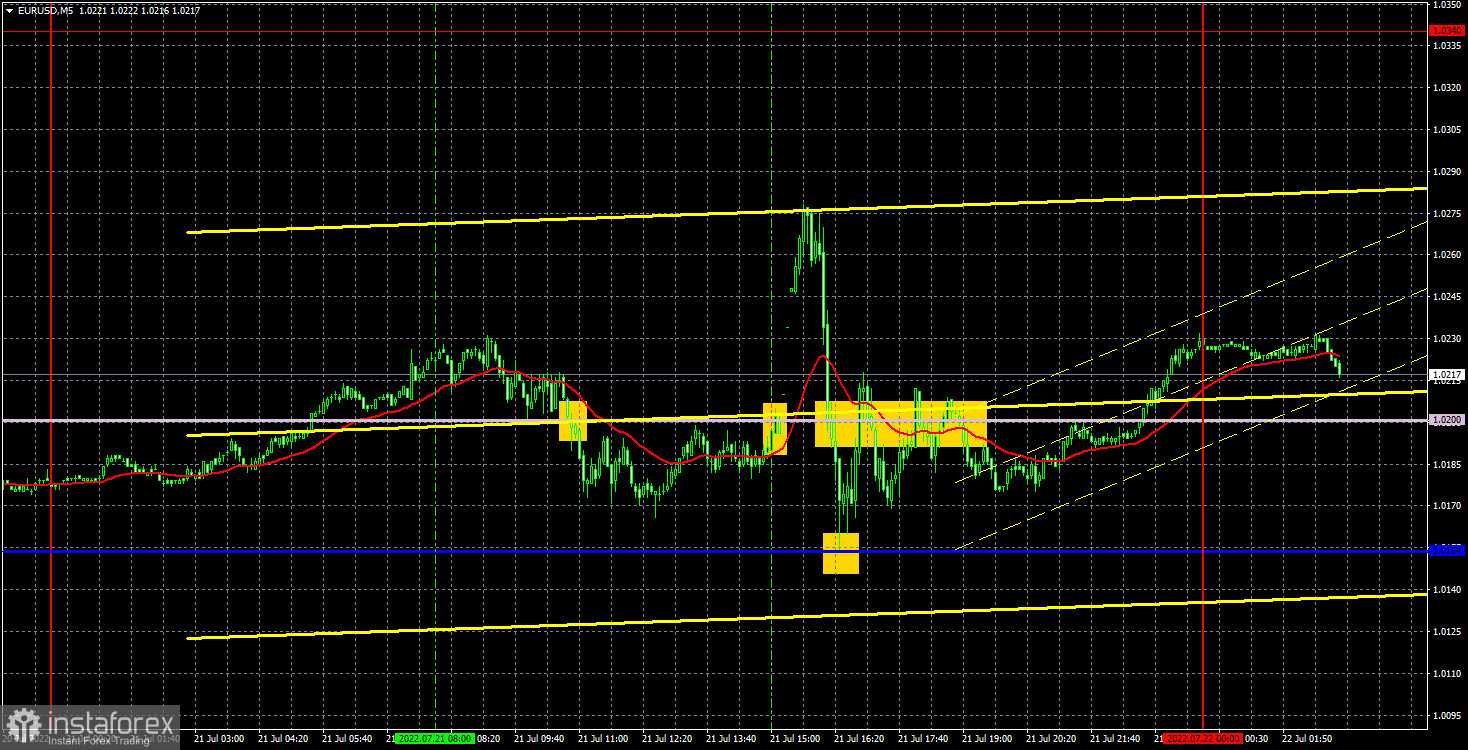
The EUR/USD pair showed an enviable "swing" on Thursday, which, however, did not surprise anyone. From the very beginning of the week, we have been saying that the European Central Bank meeting could provoke strong movements, and most importantly, unpredictable movements. However, in reality, we received not only unpredictable movements, we also received a surprise from the ECB in the form of a rate hike by 0.5% at once. Recall that this was the least likely of the two options. However, as we see, the ECB decided on such a decision, which was supposed to provoke the euro's growth. It provoked it, but only for a very short period of time, afterwards the euro collapsed. Why did it happen? We don't even bother to try to figure it out, because it doesn't make any sense. Very often, after the meetings of the central banks, we see such movements that it would be impossible to imagine before the meeting. And yesterday's meeting was no exception. Thus, the euro remains close to its local highs, in close proximity to 20-year lows and has failed to overcome the level of 1.0269 three times. If the Ichimoku indicator lines are broken, then the long-term downward trend will resume.
As for trading signals, everything was complicated on Thursday. Let's start with the fact that the movements were quite calm in the first half of the day. Only one signal was formed, and even that one was false, since the price could not fall to the critical line. But the short position was still closed at breakeven by Stop Loss. Then a buy signal was formed near the Senkou Span B line, but it was formed at the time when the ECB announced the results of the meeting. Therefore, it was not necessary to take risks and work it out. Then there was a good signal near the critical line, which could earn a couple of tens of points, but all subsequent signals near the Senkou Span B line should have been ignored, since the first two turned out to be false.
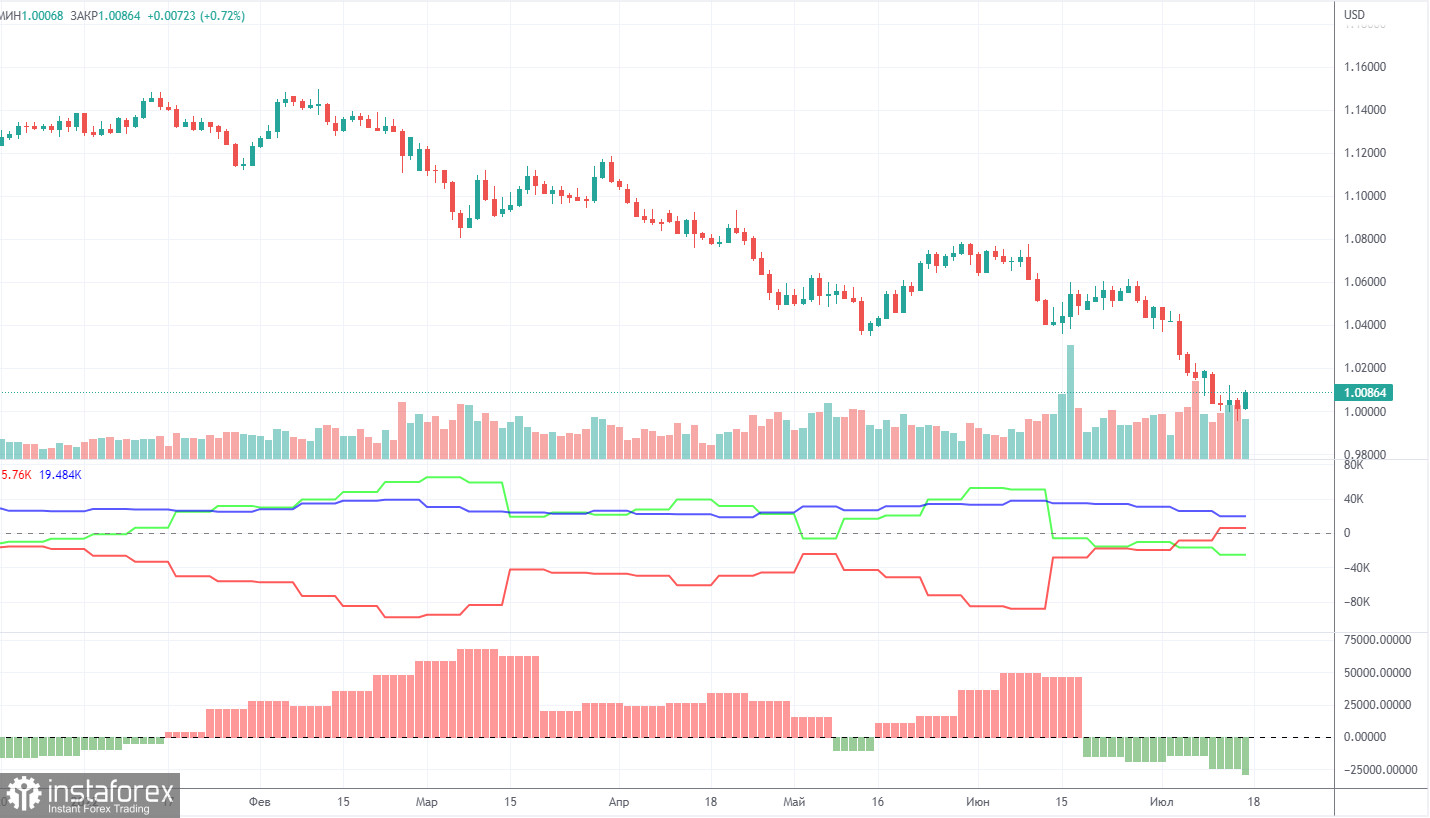
Commitment of Traders (COT) reports on the euro over the past six months have raised a huge number of questions. The chart above clearly shows that they showed a blatant bullish mood of commercial players, but at the same time, the euro was falling. At this time, the situation has changed, and NOT in favor of the euro. If earlier the mood was bullish, but the euro was falling, now the mood has become bearish and... the euro is also falling. Therefore, for the time being, we do not see any grounds for the euro's growth, because the vast majority of factors remain against it. During the reporting week, the number of long positions increased by 100, and the number of shorts in the non-commercial group increased by 8,500. Accordingly, the net position decreased again, by almost 8,500 contracts. The mood of the big players remains bearish and has even increased slightly in recent weeks. From our point of view, this fact very eloquently indicates that at this time even commercial traders do not believe in the euro. The number of longs is lower than the number of shorts for non-commercial traders by 25,000. Therefore, we can state that not only the demand for the US dollar remains high, but also the demand for the euro is quite low. This may lead to a new, even greater fall of the euro. In principle, over the past few months or even more, the euro has not been able to show even a tangible correction, not to mention something more. The highest upward movement was about 400 points.
Overview of the EUR/USD pair. July 22. The ECB is the last of the major central banks to join the fight against inflation.
Overview of the GBP/USD pair. July 22. Elections in the UK: two candidates left.
Forecast and trading signals for GBP/USD on July 22. Detailed analysis of the movement of the pair and trading transactions.
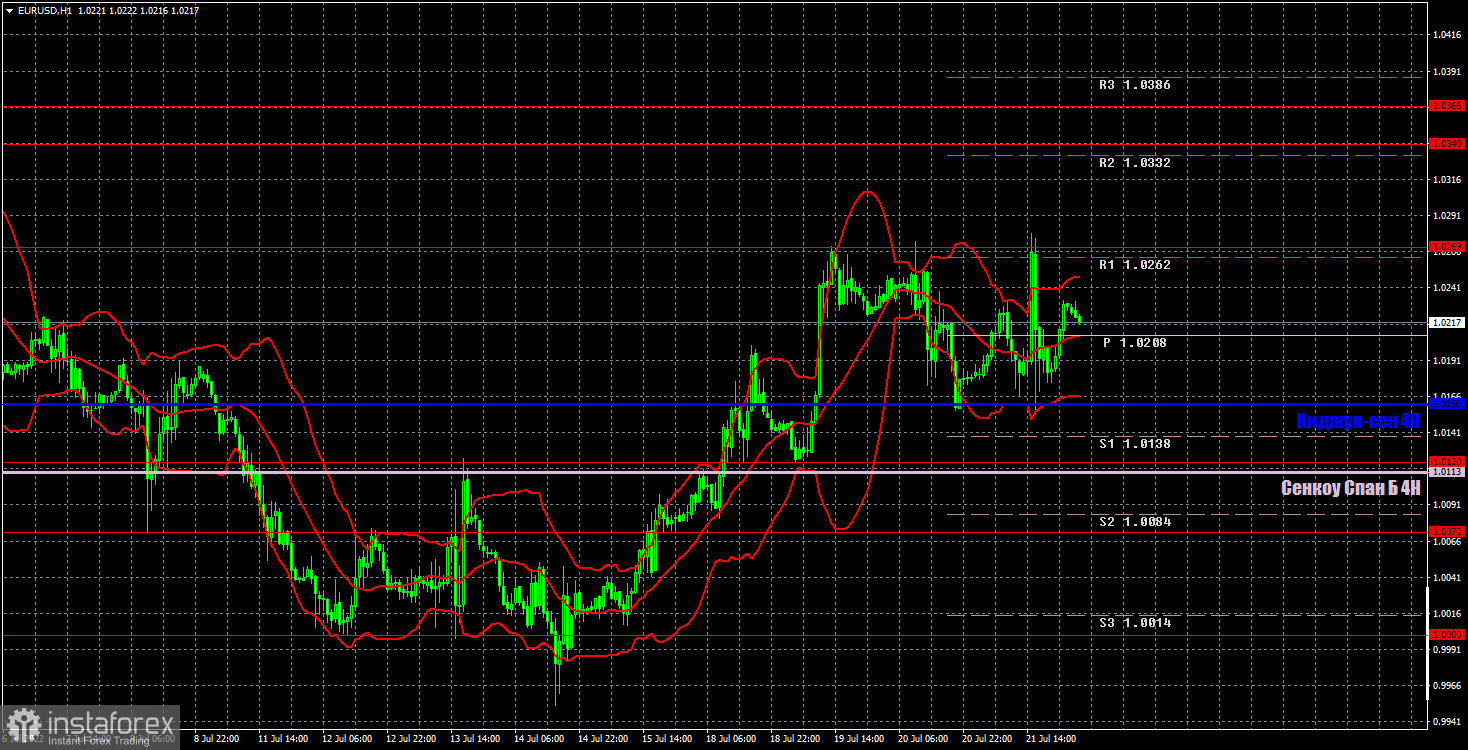
The nature of the pair's movement from yesterday is clearly visible on the hourly timeframe. We even fear that now a flat may begin between the Kijun-sen line and the level of 1.0269. Formally, the euro may continue to grow, as it continues to settle above the lines of the Ichimoku indicator. We highlight the following levels for trading on Friday - 1.0000, 1.0072, 1.0120, 1.0269, 1.0340-1.0366, 1.0485, as well as Senkou Span B (1.0113) and Kijun-sen (1.0160) lines. Ichimoku indicator lines can move during the day, which should be taken into account when determining trading signals. There are also secondary support and resistance levels, but no signals are formed near them. Signals can be "rebounds" and "breakthrough" extreme levels and lines. Do not forget about placing a Stop Loss order at breakeven if the price has gone in the right direction for 15 points. This will protect you against possible losses if the signal turns out to be false. Indexes of business activity will be published in the US and the European Union. If one or more indexes fall below the critical level of 50.0, this may provoke a market reaction.
Support and Resistance Levels are the levels that serve as targets when buying or selling the pair. You can place Take Profit near these levels.
Kijun-sen and Senkou Span B lines are lines of the Ichimoku indicator transferred to the hourly timeframe from the 4-hour one.
Support and resistance areas are areas from which the price has repeatedly rebounded off.
Yellow lines are trend lines, trend channels and any other technical patterns.
Indicator 1 on the COT charts is the size of the net position of each category of traders.
Indicator 2 on the COT charts is the size of the net position for the non-commercial group.
InstaForex analytical reviews will make you fully aware of market trends! Being an InstaForex client, you are provided with a large number of free services for efficient trading.


