 Stay
Stay 
Trading Conditions
Products
Tools


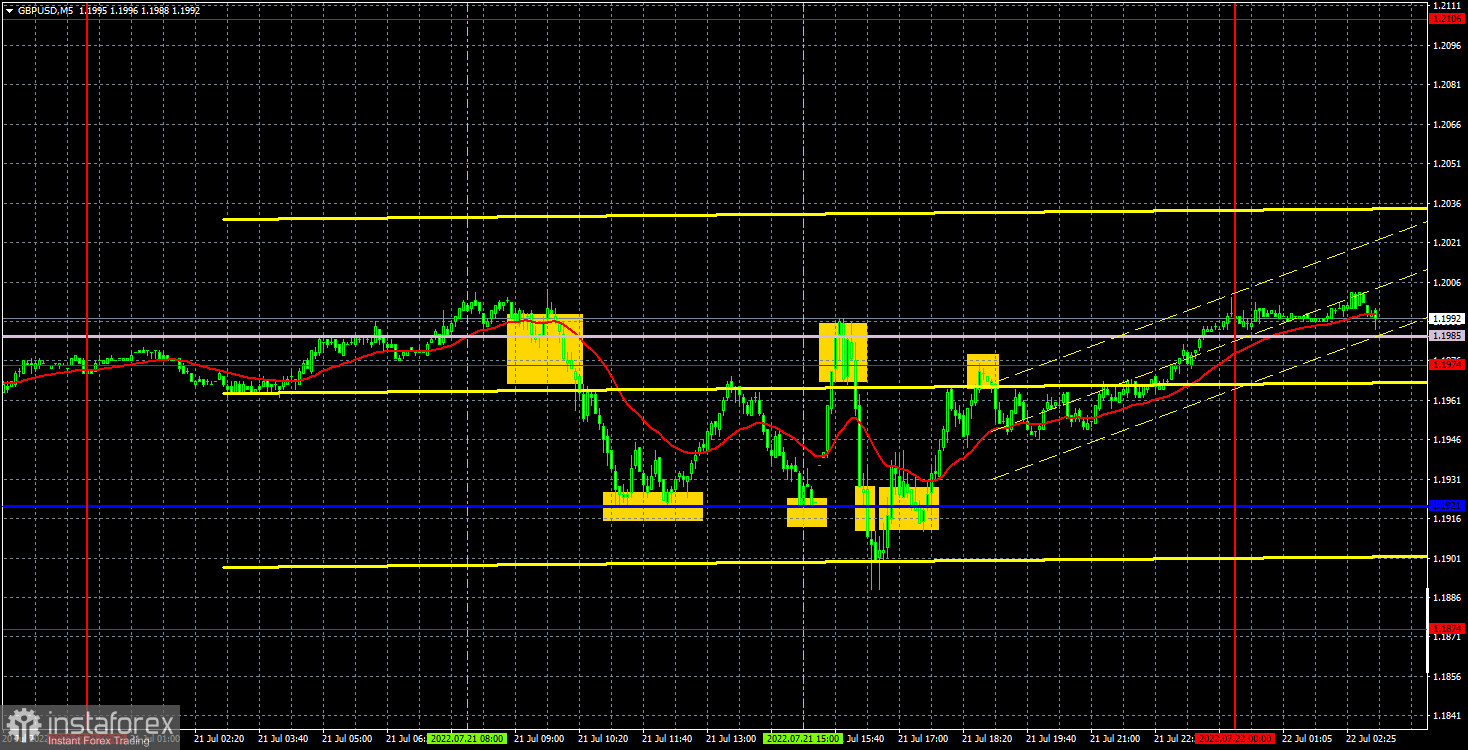
The GBP/USD currency pair continued to trade almost identically to the EUR/USD pair on Thursday. Even at the time when the results of the European Central Bank meeting were announced, which had nothing to do with the pound, both pairs showed the same movements. By the end of the day, the pound managed to stay above the lines of the Ichimoku indicator, so formally the upward trend continues. At the same time, the pair failed to overcome the level of 1.2033 three times, so further upward movement is a big question. Now we need the price to get out of the horizontal channel between the Kijun-sen line and the level of 1.2033. No important report from either the US or the UK on Thursday. However, as we can see, this did not prevent traders from being active. The pound continues to follow the euro with might and main, which really raises big questions.
There were plenty of trading signals on Thursday. The price overcame the Senkou Span B line area even at the European trading session - the level of 1.1974, having formed a sell signal. After that, it dropped to the critical line, from which it rebounded and formed a buy signal. Shorts should be closed on this signal and longs opened. Unfortunately, as part of the upward movement, the pair failed to reach the nearest target level of only 4 points, after which it returned to the critical line. Therefore, the long position was closed at breakeven by Stop Loss. A new buy signal was formed during the announcement of the results of the ECB meeting and traders would not have had time to work it out, even if they wanted to. The next sell signal was formed again in the area of 1.1974-1.1985, after which the quotes went even below the critical line. And the shorts should have been closed after consolidating above the Kijun-sen line, also in profit. The last buy signal near the critical line was also workable, and it also allowed traders to earn profit, as the price managed to ideally rise to the level of 1.1974. The rebound from 1.1974 should not have been worked out, since this signal was formed rather late. In total, it was possible to earn about 80 points on Thursday.
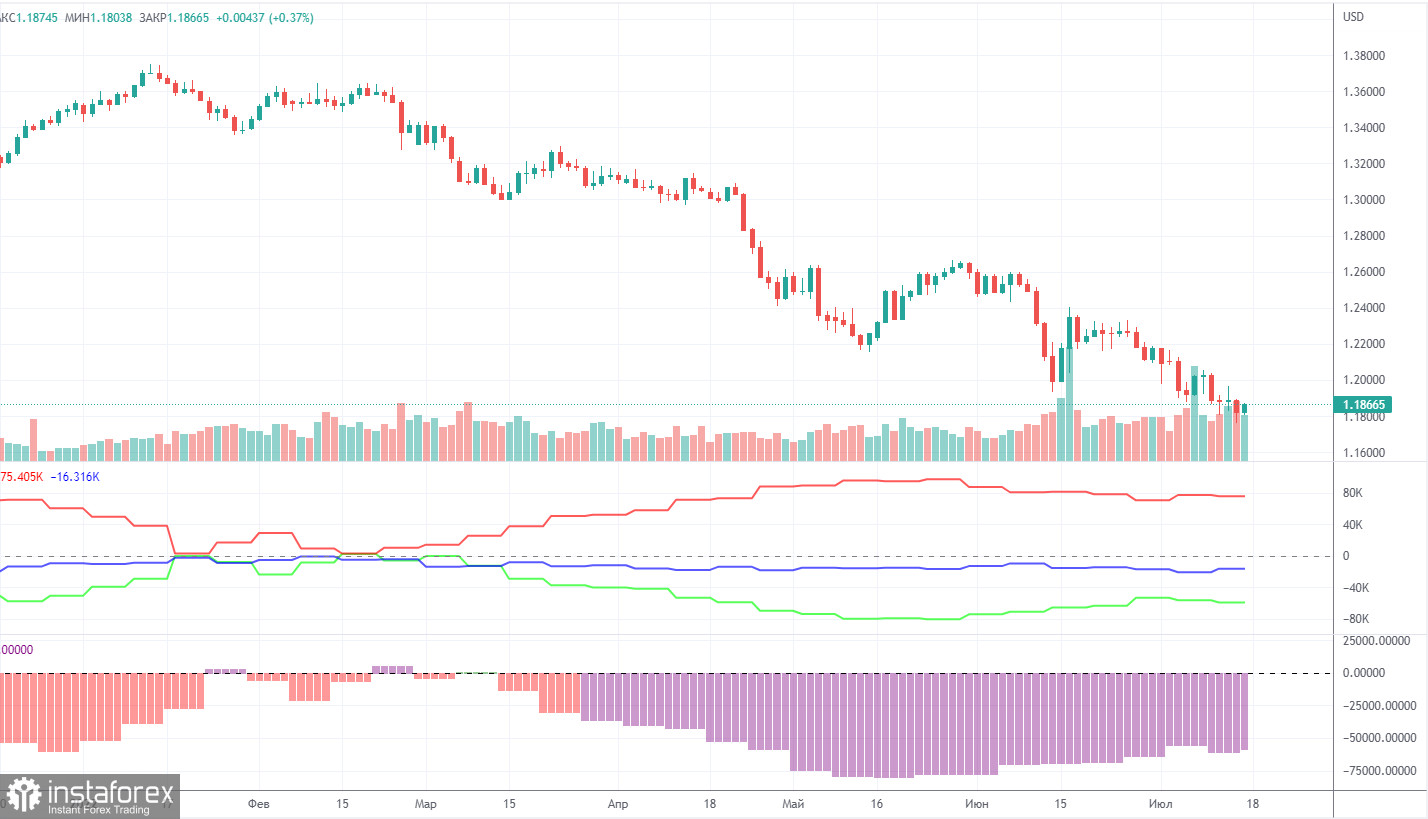
The latest Commitment of Traders (COT) report on the British pound again showed insignificant changes. During the week, the non-commercial group closed 5,700 longs and 2,800 shorts. Thus, the net position of non-commercial traders increased by 2,900. But what does it matter if the mood of the big players still remains "pronounced bearish", which is clearly seen in the second indicator in the chart above? And the pound, in spite of everything, still cannot show even a tangible upward correction? The net position fell for three months, then grew for some time, but what's the difference if the British currency still continues to depreciate against the US dollar? We have already said that the COT reports do not take into account the demand for the dollar, which is probably still very high right now. Therefore, even for the strengthening of the British currency, the demand for it must grow faster and stronger than the demand for the dollar. The non-commercial group currently has a total of 93,000 shorts open and only 34,000 longs. The net position will have to show growth for a long time to at least equalize these figures. Neither macroeconomic statistics nor fundamental events support the UK currency. As before, we can only count on corrective growth, but we believe that in the medium term, the pound will continue to fall.
Overview of the EUR/USD pair. July 22. The ECB is the last of the major central banks to join the fight against inflation.
Overview of the GBP/USD pair. July 22. Elections in the UK: two candidates left.
Forecast and trading signals for EUR/USD on July 22. Detailed analysis of the movement of the pair and trading transactions.
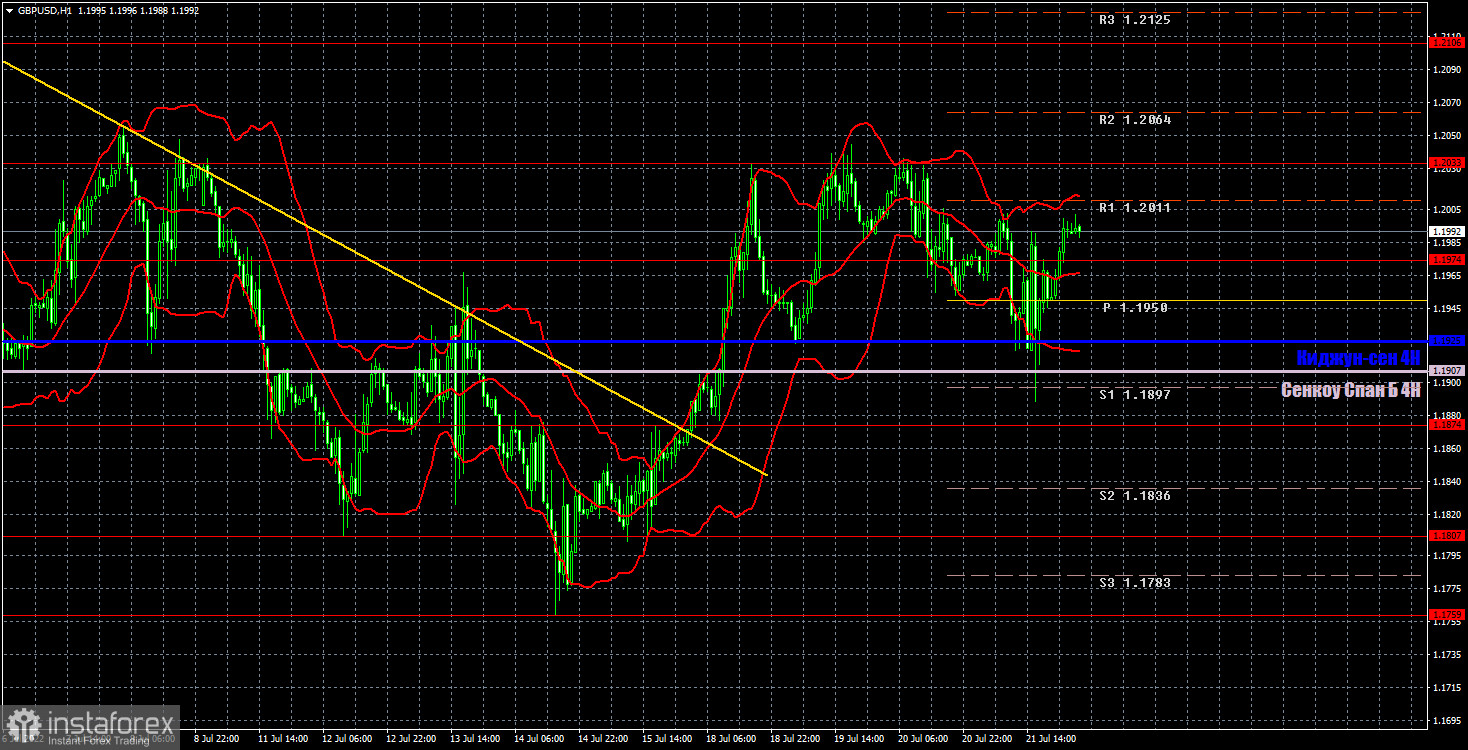
The pound is desperately trying to maintain an upward trend and stay above the lines of the Ichimoku indicator. If it succeeds, then it will be possible to count on another test of the level of 1.2033. Otherwise, the downward trend will resume. We highlight the following important levels for July 22: 1.1807, 1.1874, 1.1974, 1.2033, 1.2106, 1.2175. The Senkou Span B (1.1907) and Kijun-sen (1.1925) lines can also be sources of signals. Signals can be "rebounds" and "breakthrough" of these levels and lines. The Stop Loss level is recommended to be set to breakeven when the price passes in the right direction by 20 points. Ichimoku indicator lines can move during the day, which should be taken into account when determining trading signals. The chart also contains support and resistance levels that can be used to take profits on trades. Indexes of business activity in the services and manufacturing sectors will be published in the UK and the US, which will be able to provoke a market reaction only if they turn out to be much lower than forecasts. A report on retail sales will also be released in the UK, which is about the same degree of importance as the indices.
Support and Resistance Levels are the levels that serve as targets when buying or selling the pair. You can place Take Profit near these levels.
Kijun-sen and Senkou Span B lines are lines of the Ichimoku indicator transferred to the hourly timeframe from the 4-hour one.
Support and resistance areas are areas from which the price has repeatedly rebounded off.
Yellow lines are trend lines, trend channels and any other technical patterns.
Indicator 1 on the COT charts is the size of the net position of each category of traders.
Indicator 2 on the COT charts is the size of the net position for the non-commercial group.
InstaForex analytical reviews will make you fully aware of market trends! Being an InstaForex client, you are provided with a large number of free services for efficient trading.


