 Stay
Stay 
Trading Conditions
Products
Tools


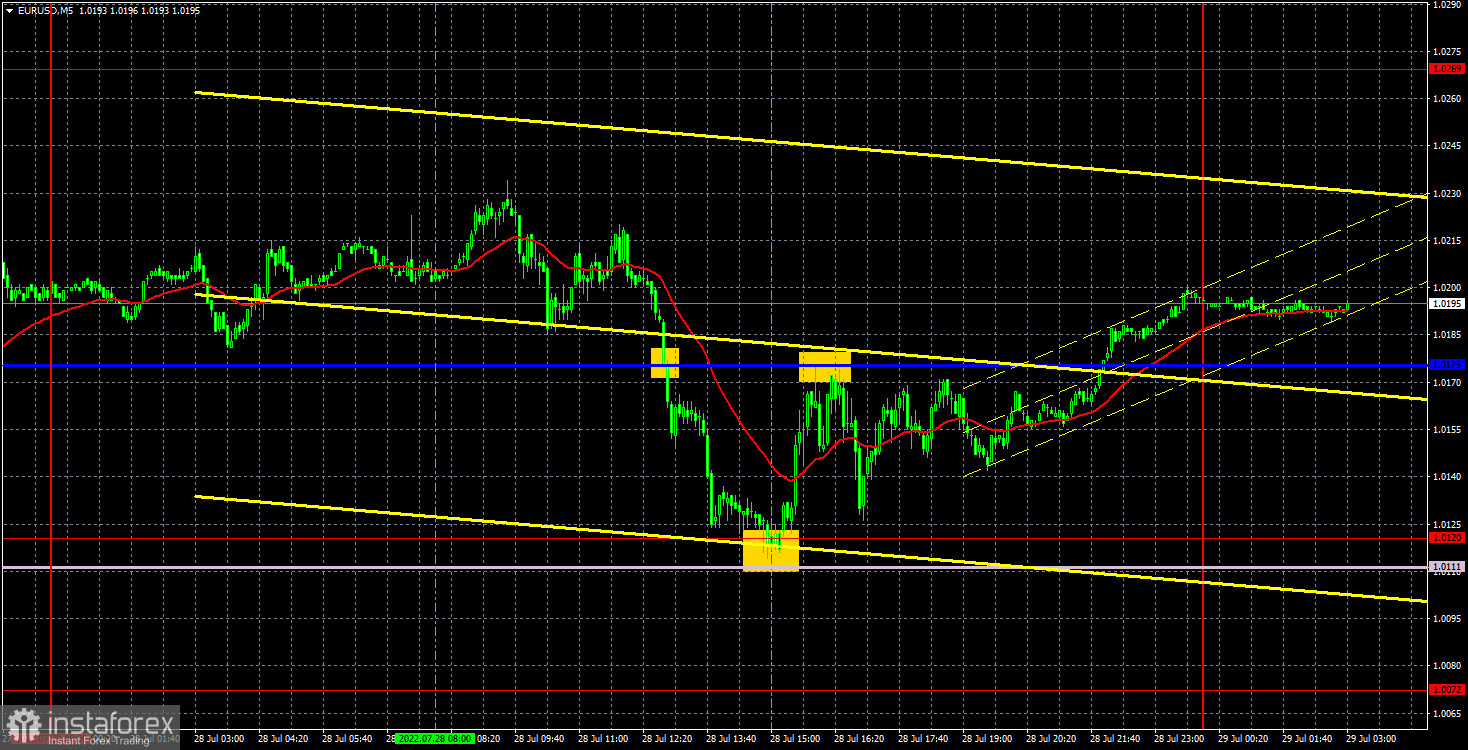
The EUR/USD pair quite predictably fell on Thursday. Moreover, it should immediately be noted that the macroeconomic background of the day was on the euro's side, since the only important report of the day - on US GDP in the second quarter - turned out to be simply a failure. Thus, the euro, if traders really had such intentions after the Federal Reserve meeting, could continue to grow. But instead, it fell back to the level of 1.0120, which, we recall, is the lower boundary of the horizontal channel. As a result, the pair continues to trade inside the horizontal channel, and all its growth on Wednesday evening was easily offset on Thursday morning. As we said, the market reaction to the outcome of the Fed meeting may be long-term. Therefore, at the European session, we were faced with a sincere misunderstanding. Why did the dollar fall the day before, if the Fed rate rose again by 0.75%? We believe that the US central bank's rate hike coupled with Fed Chairman Jerome Powell's hawkish comments will provoke a new strengthening of the US currency, despite the disappointing GDP report. Otherwise, the pair will remain inside the horizontal channel for some time.
As for trading signals, there were three of them on Thursday. Unfortunately, we did not manage to catch the beginning of the fall of quotes in the European session, since there was not a single important level in that area. However, the very first signal to sell - overcoming the critical line - turned out to be strong and managed to earn 32 points on it. This was followed by a rebound from the extreme level of 1.0120, after which the pair returned to the Kijun-sen line and rebounded from it. Another 30 points profit. A rebound from the critical line could also be worked out, but after that there were no more signals, so the deal had to be closed manually with a profit of another 10-15 points.
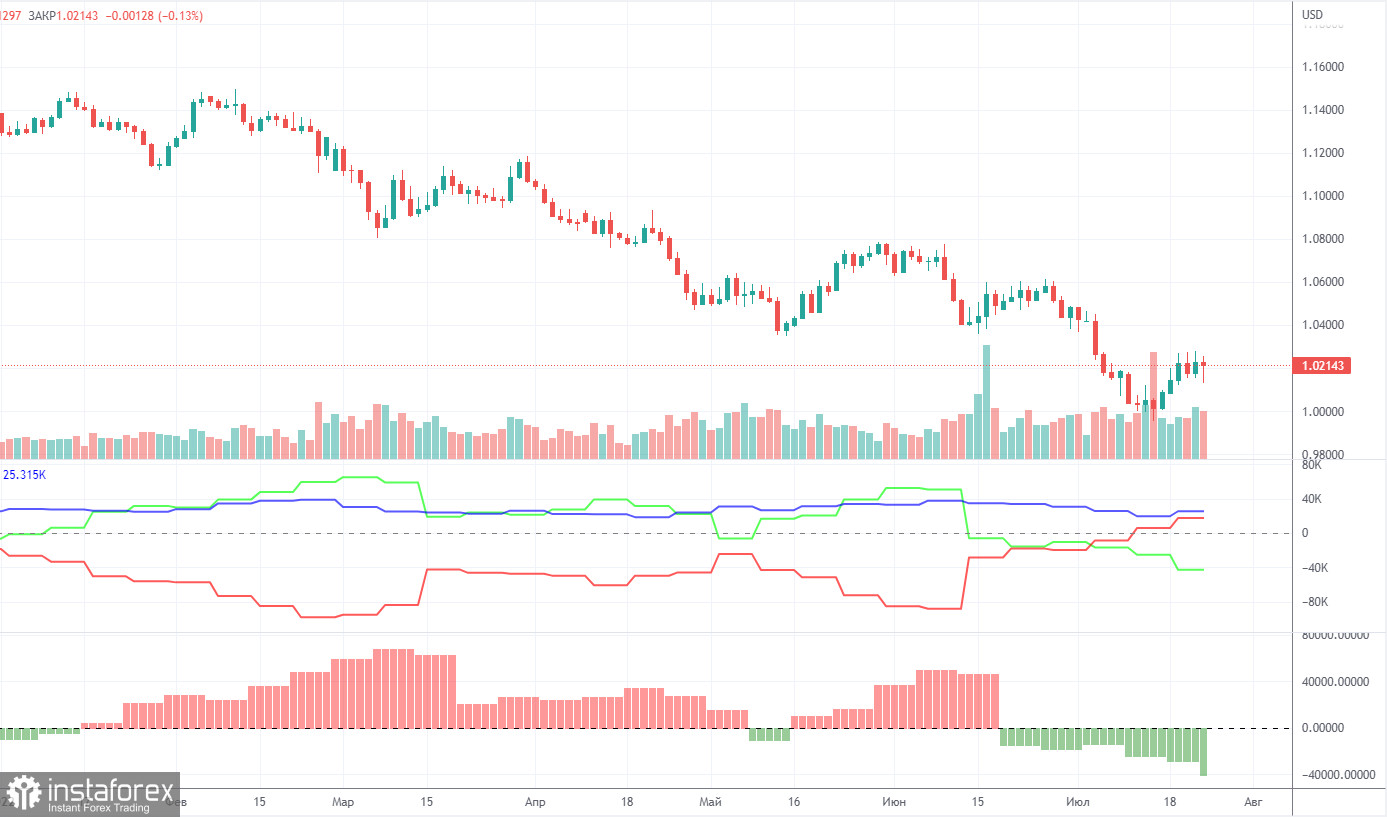
The Commitment of Traders (COT) reports on the euro over the past six months have raised a huge number of questions. The chart above clearly shows that for most of 2022 they showed an openly bullish mood of professional players, but at the same time, the euro was falling at the same time. At this time, the situation has changed, and NOT in favor of the euro. If earlier the mood was bullish, but the euro was falling, now the mood has become bearish and... the euro is also falling. Therefore, for the time being, we do not see any grounds for the euro's growth, because the vast majority of factors remain against it. During the reporting week, the number of long positions decreased by 1,300, while the number of shorts in the non-commercial group increased by 16,000. Accordingly, the net position decreased again, by almost 15,000 contracts. The mood of the big players remains bearish and even intensifies in recent weeks. From our point of view, this fact very eloquently indicates that at this time even professional traders do not believe in the euro. The number of longs is lower than the number of shorts for non-commercial traders by 43,000. Therefore, we can state that not only does the demand for the US dollar remain high, but that the demand for the euro is quite low. This may lead to a new, even greater fall of the euro. In principle, over the past few months or even more, the euro has not been able to show even a tangible correction, not to mention something more. The highest upward movement was about 400 points.
Overview of the EUR/USD pair. July 29. The euro rose after the Fed meeting, only to fall the next day.
Overview of the GBP/USD pair. July 29. The British pound, after all, maintains an upward trend and is waiting for the BoE rate hike.
Forecast and trading signals for GBP/USD on July 29. Detailed analysis of the movement of the pair and trading transactions.
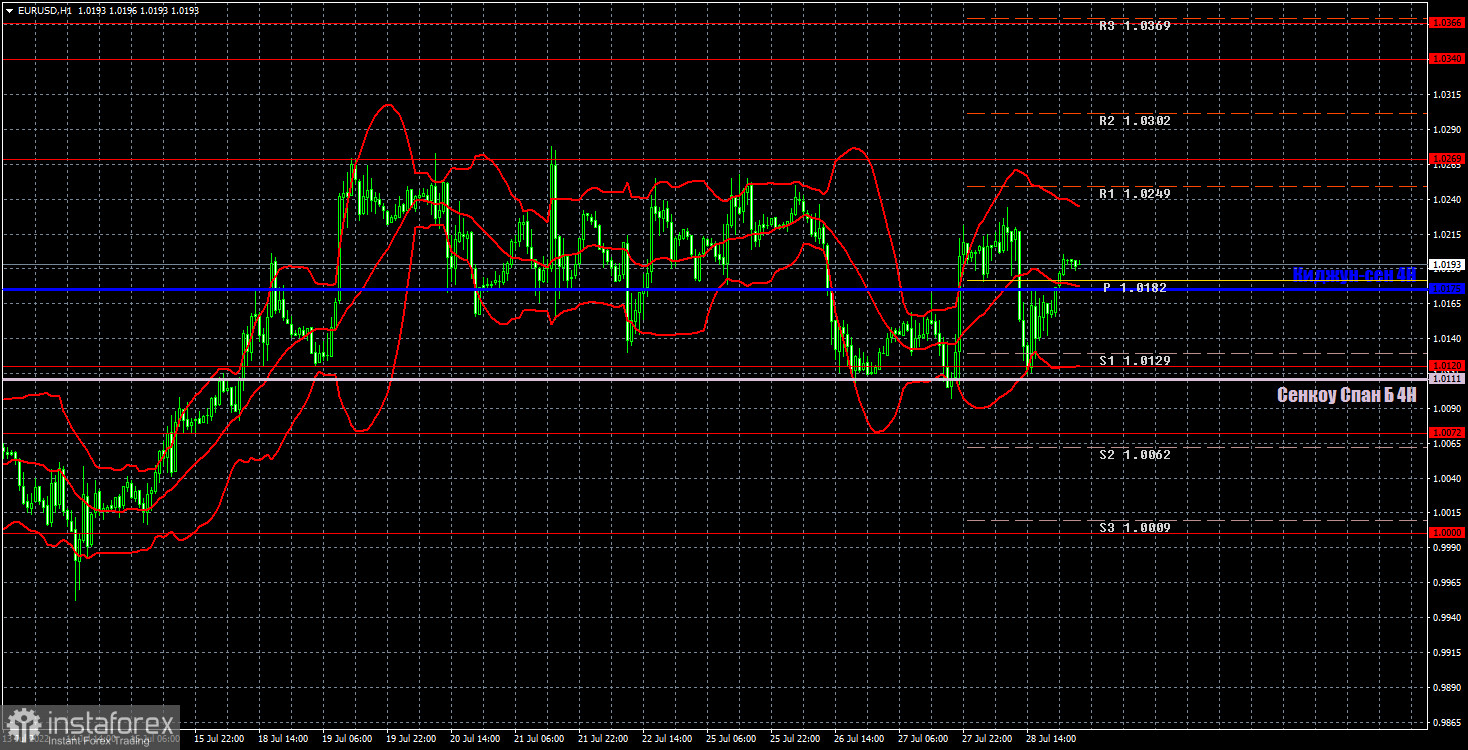
The pair continues to trade between the levels of 1.0120 and 1.0269 on the hourly timeframe. Thus, the flat remains and may continue for some time. Actually, until the moment the pair leaves the horizontal channel. In general, we expect to overcome its lower limit. We highlight the following levels for trading on Friday - 1.0000, 1.0072, 1.0120, 1.0269, 1.0340-1.0366, 1.0485, as well as the Senkou Span B (1.0111) and Kijun-sen lines (1.0175). Ichimoku indicator lines can move during the day, which should be taken into account when determining trading signals. There are also secondary support and resistance levels, but no signals are formed near them. Signals can be "rebounds" and "breakthrough" extreme levels and lines. Do not forget about placing a Stop Loss order at breakeven if the price has gone in the right direction for 15 points. This will protect you against possible losses if the signal turns out to be false. Important reports will finally be published in the European Union on July 29 - these are reports on inflation and GDP in the second quarter. This data can provoke a strong movement. But there will be no important statistics on Friday in the US.
Support and Resistance Levels are the levels that serve as targets when buying or selling the pair. You can place Take Profit near these levels.
Kijun-sen and Senkou Span B lines are lines of the Ichimoku indicator transferred to the hourly timeframe from the 4-hour one.
Support and resistance areas are areas from which the price has repeatedly rebounded off.
Yellow lines are trend lines, trend channels and any other technical patterns.
Indicator 1 on the COT charts is the size of the net position of each category of traders.
Indicator 2 on the COT charts is the size of the net position for the non-commercial group.
InstaForex analytical reviews will make you fully aware of market trends! Being an InstaForex client, you are provided with a large number of free services for efficient trading.

