 Stay
Stay 
Trading Conditions
Products
Tools


Total data on the index of business activity in the services sector, as well as a composite index, will be published around the world today. However, as in the case of the manufacturing index, this will not affect the market in any way, since the data should only confirm preliminary estimates. The market has already included them in the current quotes.
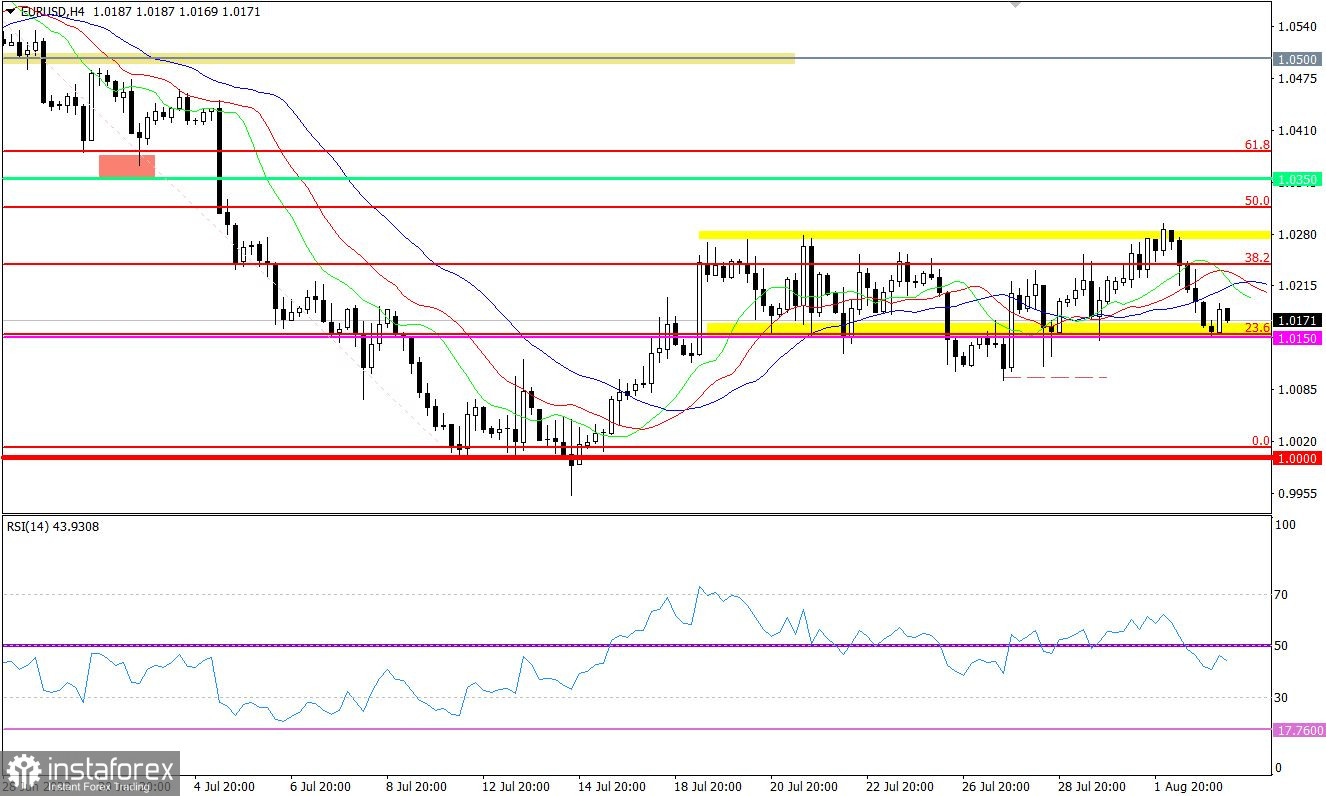
As for technical analysis, the EURUSD currency pair has been moving within the horizontal channel of 1.0150/1.0270 for the second consecutive week, consistently working out the set boundaries. Yesterday, there was an interest in dollar positions on the Forex market. As a result, the quote fell from 1.0270 to 1.0150, eventually completing the cycle from the upper to the lower border of the flat.
The technical instrument RSI H4, moving from the upper to the lower border of the flat, crossed the 50 middle line upwards. This signal fits within the development of the flat. Thus, it is too early to talk about cardinal changes in the market. RSI D1 bounced off the 50 line, this move indicates that the flat stage is still relevant in the market.
MA moving lines on Alligator H4 have many intersections, which corresponds to the flat stage. The indicator in the daily period indicates a slowdown in the downward trend, with green and red MA lines intertwining.
There is a corrective move in the structure of the downward trend on the chart of the daily period. The parity level area serves as a support.
In this situation, traders are still focused on two main strategies: a rebound and a breakthrough of the relative set boundaries of the flat.
Strategy details:
A rebound from one or another flat border considers local price movements. The work implies a moderate risk, at which it is possible to take part of the move from each cycle of building a flat.
In the case of tactics of working on the breakthrough, special attention is paid to the values: 1.0300 in case of an upward scenario and 1.0100, in case of a downward market development. Signal confirmation should occur in a four-hour period in the form of retaining the price.
Complex indicator analysis has a variable signal in the short-term and intraday periods due to the current flat. At the moment, the indicators point to selling the euro, due to the convergence of prices with the lower border of flats. Technical instruments in the medium term are still focused on a downward trend.
InstaForex analytical reviews will make you fully aware of market trends! Being an InstaForex client, you are provided with a large number of free services for efficient trading.


