 Stay
Stay 
Trading Conditions
Products
Tools


Trend analysis (fig. 1).
Today, the pair may try to reach the Fibonacci retracement level of 76.4%, 1.2196 (red dotted line) from the level of 1.2076 (the closing of yesterday's daily candlestick. When testing this level, the price could decline to the Fibonacci retracement level of 23.6% - 1.2166 (blue dotted line). From this level, it may resume an upward movement.
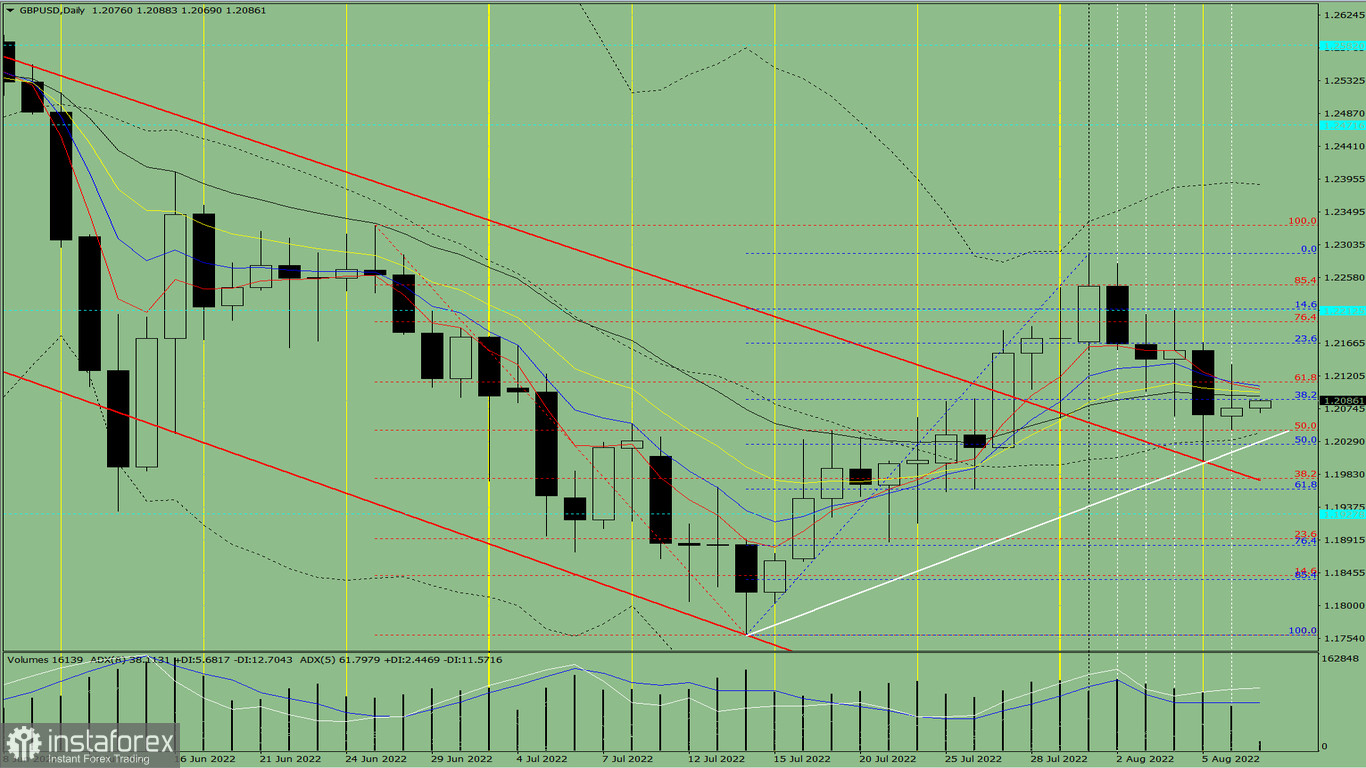
Fig. 1 (daily chart).
Complex analysis:
- indicator analysis– up;- Fibonacci levels – up;- trading volumes – up;- candlestick analysis – up;- trend analysis – up;- Bollinger bands – up;- weekly chart-up.
Conclusion
Today, the pair may try to reach the Fibonacci retracement level of 76.4%, 1.2196 (red dotted line) from the level of 1.2076 (the closing of yesterday's daily candlestick. When testing this level, the price could decline to the Fibonacci retracement level of 23.6% - 1.2166 (blue dotted line). From this level, it may resume an upward movement.
Alternatively, the price may decrease to the support level of 1.2028 (white bold line) from 1.2076 (closing of yesterday's daily candlestick). When testing this level, the price could try to hit the retracement level of 61.8% – 1.2112 (red dotted line). It is likely to start growing again from this level.
InstaForex analytical reviews will make you fully aware of market trends! Being an InstaForex client, you are provided with a large number of free services for efficient trading.


