 Stay
Stay 
Trading Conditions
Products
Tools


Overview :
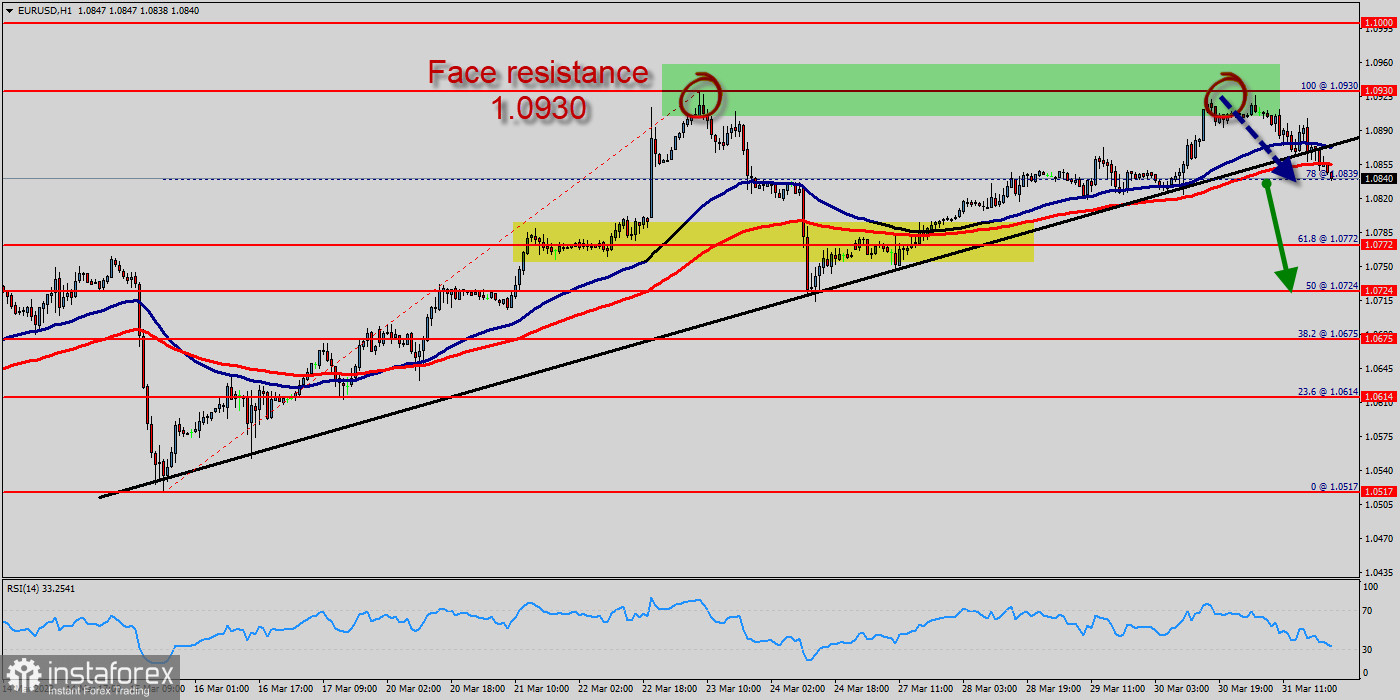
The EUR/USD pair faced strong resistances at the level of 1.0930 because this price coincided with the double top on the hourly chart since two weeks. So, the strong resistance has been already formed at the level of 1.0930 and the pair is likely to try to approach it in order to test it again, but the trend failed thrice.
Briefly, last week the EUR/USD pair traded higher and closed the day in the positive territory around 1.0930. It has also risen a little, having risen to the level of 1.0930. On the hourly chart, the GBP/USD pair is still trading above the MA (100) H1 moving average line (1.0840).
The situation is similar on the one-hour of 4H chart. Based on the foregoing, it is probably worth sticking to the south direction in trading, and as long as the GBP/USD pair remains below MA 100 H1, it may be necessary to look for entry points to buy for the formation of a correction.
However, if the pair fails to pass through the level of 1.0930 in coming two days, the market will indicate a bearish opportunity below the new strong resistance level of 1.0930 (the level of 1.0930 coincides with a ratio of 100% Fibonacci - last bullish wave - double top).
Moreover, the RSI starts signaling a downward trend, as the trend is still showing strength above the moving average (100) and (50). Thus, the market is indicating a bearish opportunity below 1.0930 so it will be good to sell at 1.0930 with the first target of 1.0772.
It will also call for a downtrend in order to continue towards 1.0724. The daily strong support is seen at 1.0675.
On the other hand, the stop loss should always be taken into account, for that it will be reasonable to set your stop loss at the level of 1.0930.
It should be noticed, the EUR/USD pair is the forex ticker that shows the value of the Euro against the US Dollar. It tells traders how many US Dollars are needed to buy a Euro. The Euro is one of the oldest and most widely traded currency pairs in the world. Follow the live EUR/USD rate with the chart and keep up to date with Euro news and analysis. Plan your trades with the EUR/USD forecast .
Probably, the main scenario is continued decrease to 1.0724 (session low).
The alternative scenario is consolidation above the MA 100 H1 level (1.0675), followed by a climp to 1.0930 (March 31 high).
InstaForex analytical reviews will make you fully aware of market trends! Being an InstaForex client, you are provided with a large number of free services for efficient trading.


