 Stay
Stay 
Trading Conditions
Products
Tools


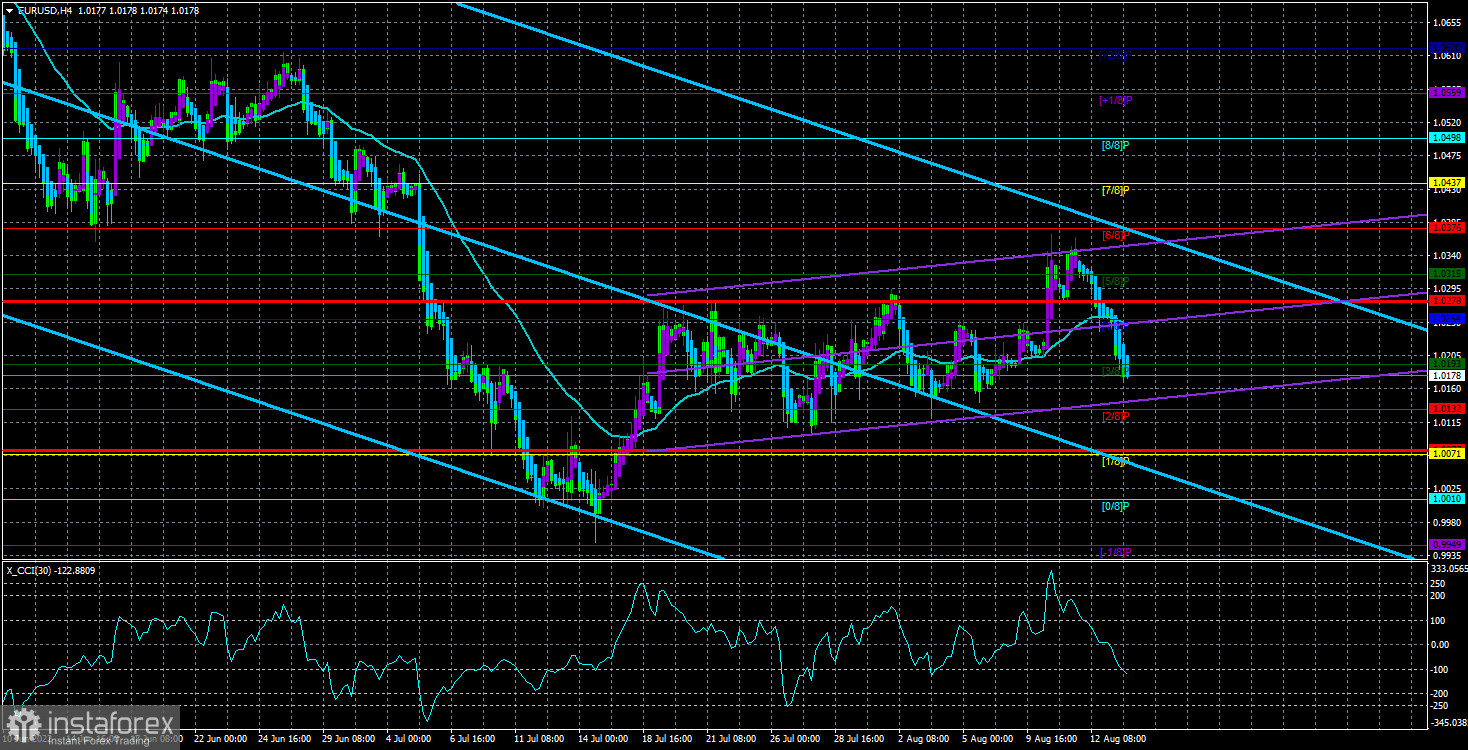
The EUR/USD currency pair fell continuously on Friday and Monday. As a result, it turned out to be below the moving average line again, and the whole movement over the past month looks like the same weak upward correction. The only problem is that, in a 4-hour timeframe, the whole movement does not look weak. However, when switching to a 24-hour TF, you can immediately understand: the current movement is a weak correction against a global downward trend. Even considering the sharp growth of the euro last week, we still cannot conclude that the market mood has changed dramatically. Nothing has changed dramatically over the past week. Neither fundamentally nor geopolitically. Recall that at least these two factors were key in strengthening the US currency in the last six months. What happened last week? Has the US inflation rate decreased by 0.6%? One report says nothing. In May, inflation also fell by a couple of tenths of a percent, but the next month it accelerated again.
The key point now remains the Fed's policy of tightening monetary policy. It consists not only of raising the key rate but also of the QT program, according to which $ 95 billion a month will be withdrawn from the economy from September 1 by selling bonds from the Fed's balance sheet. Also last week, several representatives of the Fed said that no one would ease monetary pressure since it is still very far from the target of 2% inflation. Therefore, based on how the dollar is now declining, if the ECB continues to be virtually inactive at the same time? We assumed last week that the market could have won back all future rate hikes in advance since it's no secret that the Fed will bring it up to 3.5%. However, last week, the Fed started talking about a total increase of 4% or even 4.5%, which traders could not have known in advance. And work out in advance - too. Therefore, we believe that the long-term downward trend will be resumed.
What does the new week have in store for the euro/dollar?
During the current week, at least two important reports in the European Union will deserve attention. The GDP report for the second quarter will be published on Wednesday, and inflation for July will be published on Thursday. In the case of the GDP report, this will be the second estimate. The first showed an increase of 0.7%, so it is not yet clear why many experts are now sounding the alarm about a possible recession in the European Union. GDP is growing (albeit slowly, but it is growing). The ECB barely decided to raise the rate for the first time, but it remains at an ultra-low value. Inflation also continues to grow, and no one is in a hurry to fight it. That is, everything is logical from an economic point of view. Therefore, until the ECB starts aggressively tightening monetary policy(as the Fed is doing), there is no point in expecting a strong drop in GDP.
The same goes for inflation. According to forecasts, the consumer price index will rise in July to 8.9% from 8.6% in June. Everything is also logical, because why should inflation decrease if the ECB does nothing? Consequently, the key point is the same divergence between the monetary approaches of the Fed and the ECB, which remains frankly in favor of the US currency. Therefore, we believe that macroeconomic statistics from the Eurozone will not be important for traders. They may not work it out at all. The main thing is the following – the general fundamental background remains in favor of the dollar, so we believe that the dollar will resume its growth, and the euro/dollar pair will again approach its 20-year lows in the coming weeks. From a technical point of view, everything also turns out beautifully. The pair has adjusted over the past month by 400 points (a value that it loved very much during the current downward trend), and now it has consolidated below the moving average. That is, the road to the south is open.
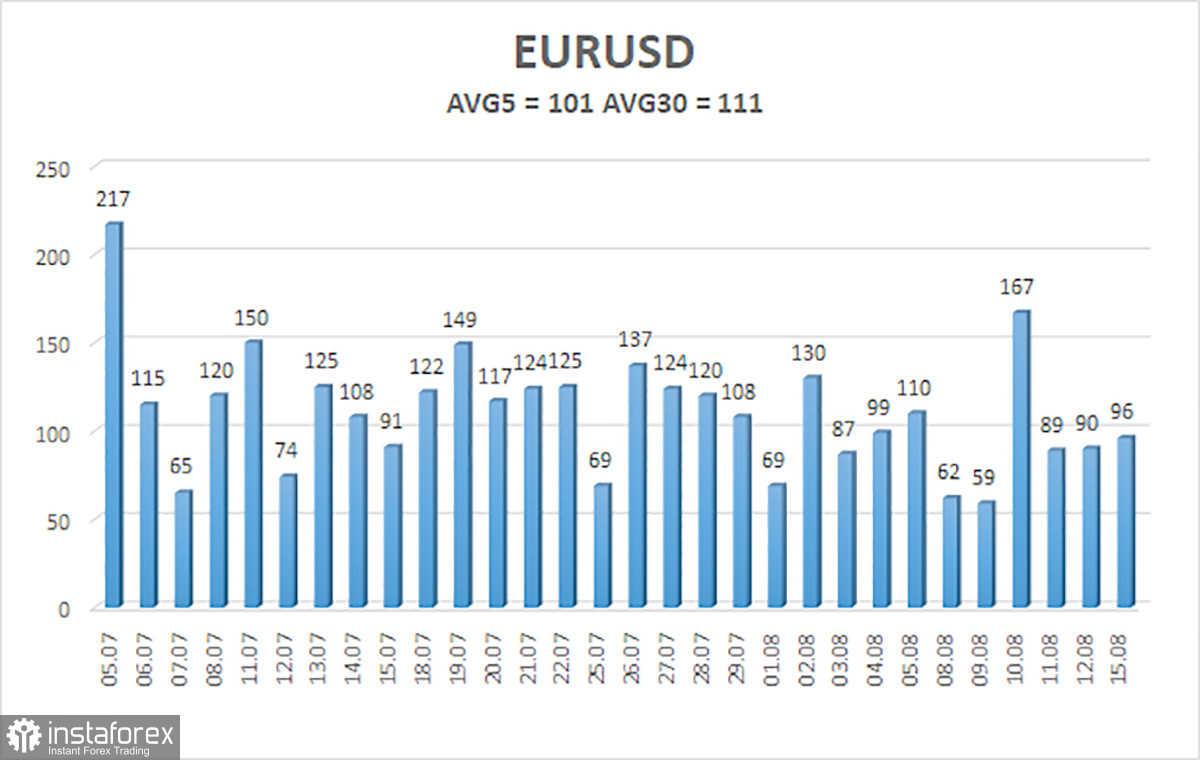
The average volatility of the euro/dollar currency pair over the last 5 trading days as of August 16 is 101 points and is characterized as "high." Thus, we expect the pair to move today between 1.0076 and 1.0278. The upward reversal of the Heiken Ashi indicator signals a round of upward correction.
Nearest support levels:
S1 – 1.0132
S2 – 1.0071
S3 – 1.0010
Nearest resistance levels:
R1 – 1.0193
R2 – 1.0254
R3 – 1.0315
Trading recommendations:
The EUR/USD pair resumed its downward movement. Thus, it is now possible to stay in short positions with targets of 1.0132 and 1.0076 until the Heiken Ashi indicator turns up. It will be possible to consider long positions after the price is fixed above the moving average with targets of 1.0315 and 1.0376.
Explanations of the illustrations:
Linear regression channels – help determine the current trend. If both are directed in the same direction, then the trend is strong.
Moving average line (settings 20.0, smoothed) – determines the short-term trend and the direction in which trading should be conducted now.
Murray levels are target levels for movements and corrections.
Volatility levels (red lines) are the likely price channel in which the pair will spend the next day, based on current volatility indicators.
The CCI indicator – its entry into the oversold area (below -250) or into the overbought area (above +250) means that a trend reversal in the opposite direction is approaching.
InstaForex analytical reviews will make you fully aware of market trends! Being an InstaForex client, you are provided with a large number of free services for efficient trading.


