 Stay
Stay 
Trading Conditions
Products
Tools


Details of the economic calendar for August 15
Monday was traditionally accompanied by an empty macroeconomic calendar. Important statistics in Europe, the United Kingdom, and the United States were not released.
In this regard, traders focused on the information flow, and practiced technical analysis.
Analysis of trading charts from August 15
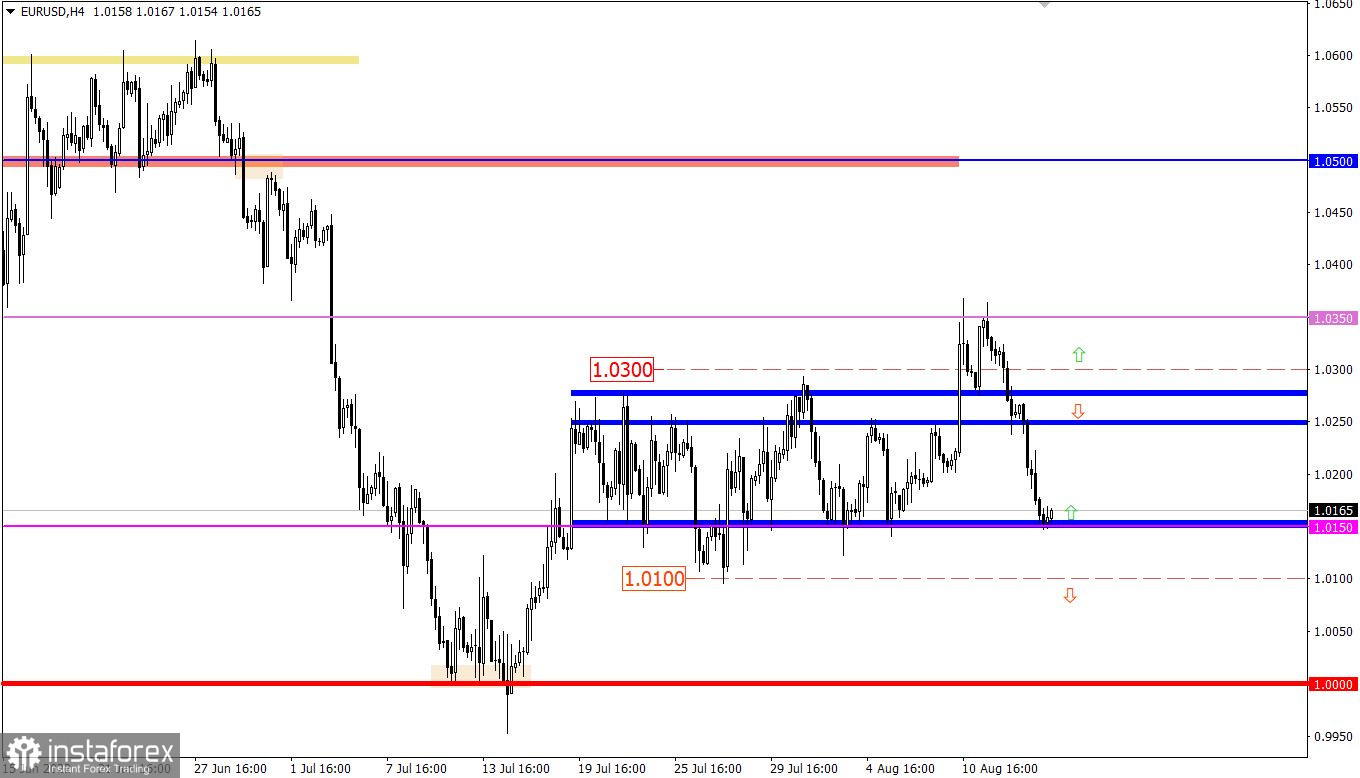
The EURUSD currency pair, during an intense downward movement from the resistance level of 1.0350, reached the lower limit of the previously passed flat of 1.0150/1.0270. As a result, there was a local reduction in the volume of short positions in the market, which led to a slowdown.
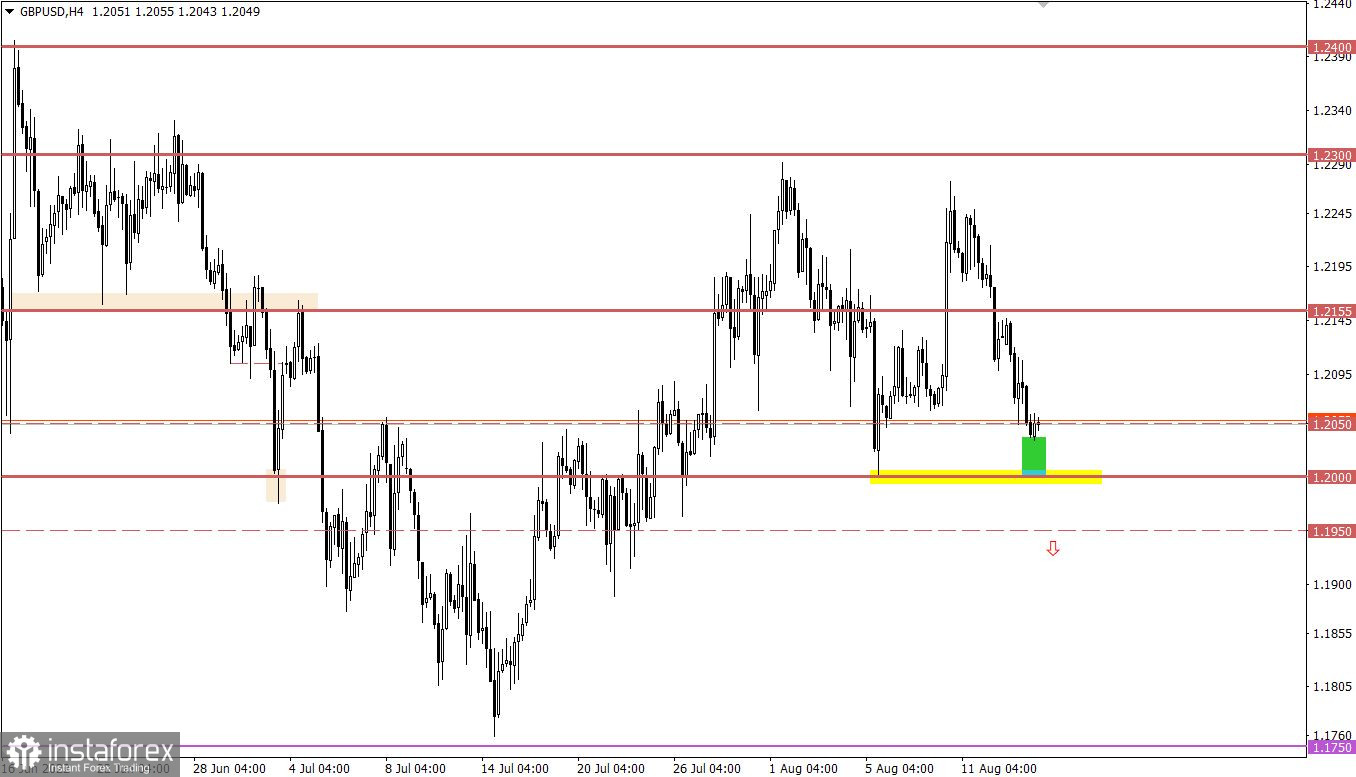
The GBPUSD currency pair accelerated its decline after breaking through a number of variable levels. As a result, the quote came close to the important psychological level of 1.2000, where it formed a small stagnation.

Economic calendar for August 16
At the opening of the European session, the UK labor market data was released, where unemployment remained at the same level of 3.8%. At the same time, employment in the country increased by 160,000 against 296,000 in the previous reporting period. Forecasts assumed that employment would grow by 256,000. At the same time, the change in the number of applications for unemployment benefits in July decreased by 10,500, which is good, but forecasts assumed -32,000.
Statistics for the UK stand out only by the unemployment rate, since everything is ambiguous on other indicators. The pound sterling was standing still at that time.
During the American trading session, data on the construction sector in the United States will be published. The number of issued building permits and the volume of new housing starts is assumed to decrease.
Subsequently, data on the volume of industrial production will be published, which is assumed to decline from 4.2% to 4.0% YoY and grow by 0.3% MoM.
Time targeting:
U.S. Building Permits Issued – 12:30 UTC (prev. 1.696M; prog. 1.65M)
US Housing Starts – 12:30 UTC (prev. 1.55 M; prog. 1.54 M)
US Industrial Production – 13:15 UTC
Trading plan for EUR/USD on August 16
Presumably, the 1.0150 area will put pressure on sellers, which may lead to a gradual slowdown in the downward cycle, resulting in a technical pullback in the market.
Traders will consider a prolonged downward cycle if the price stays below 1.0100. In this case, the quote will rush towards the parity level.
Trading plan for GBP/USD on August 16
In this situation, the area of the control level puts pressure on sellers, negatively affecting the volume of short positions. In view of the local signal about the oversold pound sterling, we can assume the formation of a pullback.
Traders will consider the next downward move if the price holds below 1.1950. Under this scenario, a resumption of the medium-term downward trend is possible.
What is shown in the trading charts?
A candlestick chart view is graphical rectangles of white and black light, with sticks on top and bottom. When analyzing each candle in detail, you will see its characteristics of a relative period: the opening price, closing price, and maximum and minimum prices.
Horizontal levels are price coordinates, relative to which a stop or a price reversal may occur. These levels are called support and resistance in the market.
Circles and rectangles are highlighted examples where the price of the story unfolded. This color selection indicates horizontal lines that may put pressure on the quote in the future.
The up/down arrows are the reference points of the possible price direction in the future.
InstaForex analytical reviews will make you fully aware of market trends! Being an InstaForex client, you are provided with a large number of free services for efficient trading.


