 Stay
Stay 
Trading Conditions
Products
Tools


Details of the economic calendar for August 16
The UK's Office for National Statistics (ONS) report on the labor market yesterday showed unemployment rate stabilized at around 3.8%. Employment in the country increased by 160,000 against 296,000 in the previous reporting period. Forecasts predicted that employment would grow by 256,000. At the same time, the change in the number of applications for unemployment benefits in July decreased by 10,500, which is good, but they predicted -32,000.
Statistics for the UK stand out only by the unemployment rate, since everything is ambiguous on other indicators. The pound sterling stood still at the time of publication.
During the American trading session, data on the construction sector in the United States were published, which recorded a widespread decline in performance.
Details:
U.S. Building Permits Issued – Prev. 1.696M; Fact. 1.674M.
U.S. Housing Starts – Prev. 1.599M; Fact. 1.446M.
Subsequently, data on the volume of industrial production were published, which recorded a slowdown from 4.02% to 3.9% YoY, and increased by 0.6% MoM.
Conclusion:
Data on the US came out negatively; the dollar was under pressure from sellers.
Analysis of trading charts from August 16
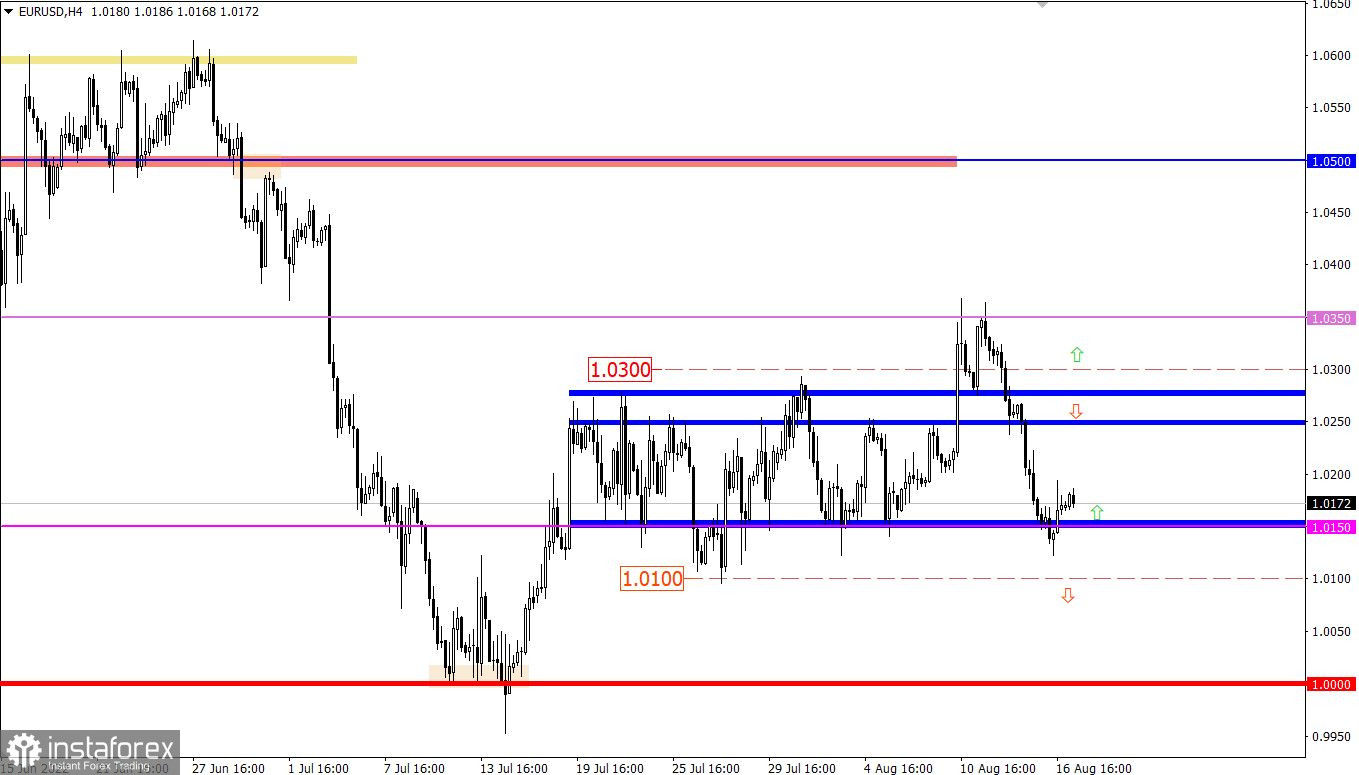
The EURUSD currency pair overcame the support level of 1.0150 locally during an intense downward movement, but the sellers failed to stay below the reference value of 1.0100. As a result, there was a pullback in the market above the support level.
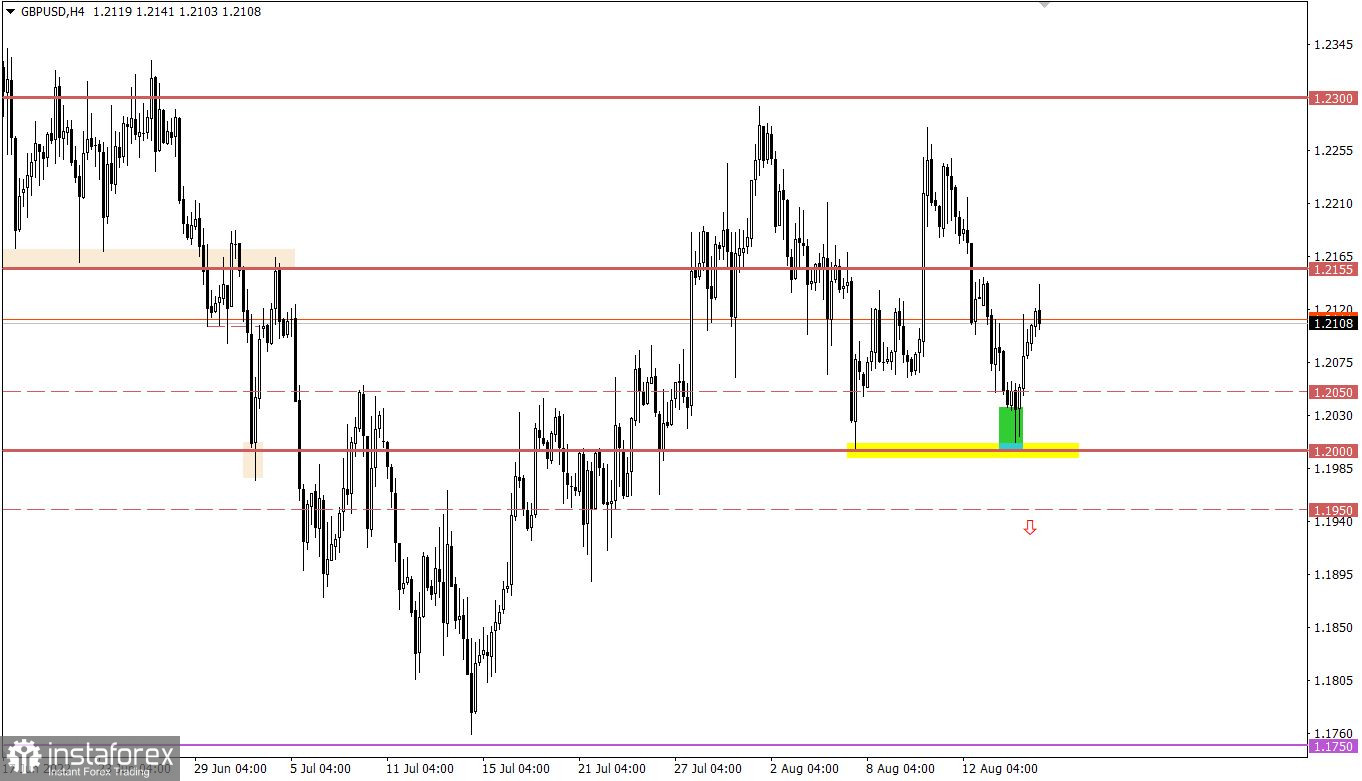
The GBPUSD currency pair rebounded from the psychological level of 1.2000 with surgical precision. As a result, there was an increase in the volume of long positions, strengthening the pound sterling by about 100 points.

Economic calendar for August 17
At the opening of the European session, data on UK inflation was published, which recorded an increase from 9.4% to 10.1%. Such a high level of inflation is likely to lead to an even stronger increase in the interest rates of the Bank of England.
In Europe, the second estimate of GDP for the second quarter will be published, where no reaction is expected since it should coincide with the first estimate, which is already included in the current quotes.
During the American trading session, traders expect retail sales data in the United States, the growth rate of which is likely to slow down from 8.4% to 8.1%. Even with a possible slowdown, retail sales are still at a high level. However, the very fact of a slowdown amid fears of a recession will be a catalyst for fear among investors. Thus, the US dollar may be under pressure.
Near the closing of the European session, and when Western traders will be in the active phase, the FOMC minutes will be published.
Time targeting:
EU GDP – 09:00 UTC
US Retail Sales – 12:30 UTC
FOMC protocol – 18:00 UTC
Trading plan for EUR/USD on August 17
Presumably, the area of the level of 1.0150 is still putting pressure on sellers. For this reason, one of the possible scenarios for the price development is a rebound towards 1.0240.
As for the prolongation of the downward cycle, this scenario will be relevant only after holding the price below 1.0100 for at least a four-hour period. In this case, the quote will rush towards the parity level.
Trading plan for GBP/USD on August 17
The pullback stage may well slow down the move around 1.2120/1.2150. In this case, there will be a gradual increase in the volume of short positions, returning the quote to the psychological level of 1.2000.
Prolonging the current pullback will be considered if the price holds above the value of 1.2160 in a four-hour period.
What is shown in the trading charts?
A candlestick chart view is graphical rectangles of white and black light, with sticks on top and bottom. When analyzing each candle in detail, you will see its characteristics of a relative period: the opening price, closing price, and maximum and minimum prices.
Horizontal levels are price coordinates, relative to which a stop or a price reversal may occur. These levels are called support and resistance in the market.
Circles and rectangles are highlighted examples where the price of the story unfolded. This color selection indicates horizontal lines that may put pressure on the quote in the future.
The up/down arrows are the reference points of the possible price direction in the future.
InstaForex analytical reviews will make you fully aware of market trends! Being an InstaForex client, you are provided with a large number of free services for efficient trading.


