 Stay
Stay 
Trading Conditions
Products
Tools


Trend analysis (Fig. 1)
GBP/USD will continue decreasing on Thursday, from 1.2044 (closing of yesterday's daily candle) to 1.1962, which is the 61.8% retracement level (dashed blue line). But then it will bounce back to the 50.0% retracement level at 1.2044 (red dotted line) and higher price levels.
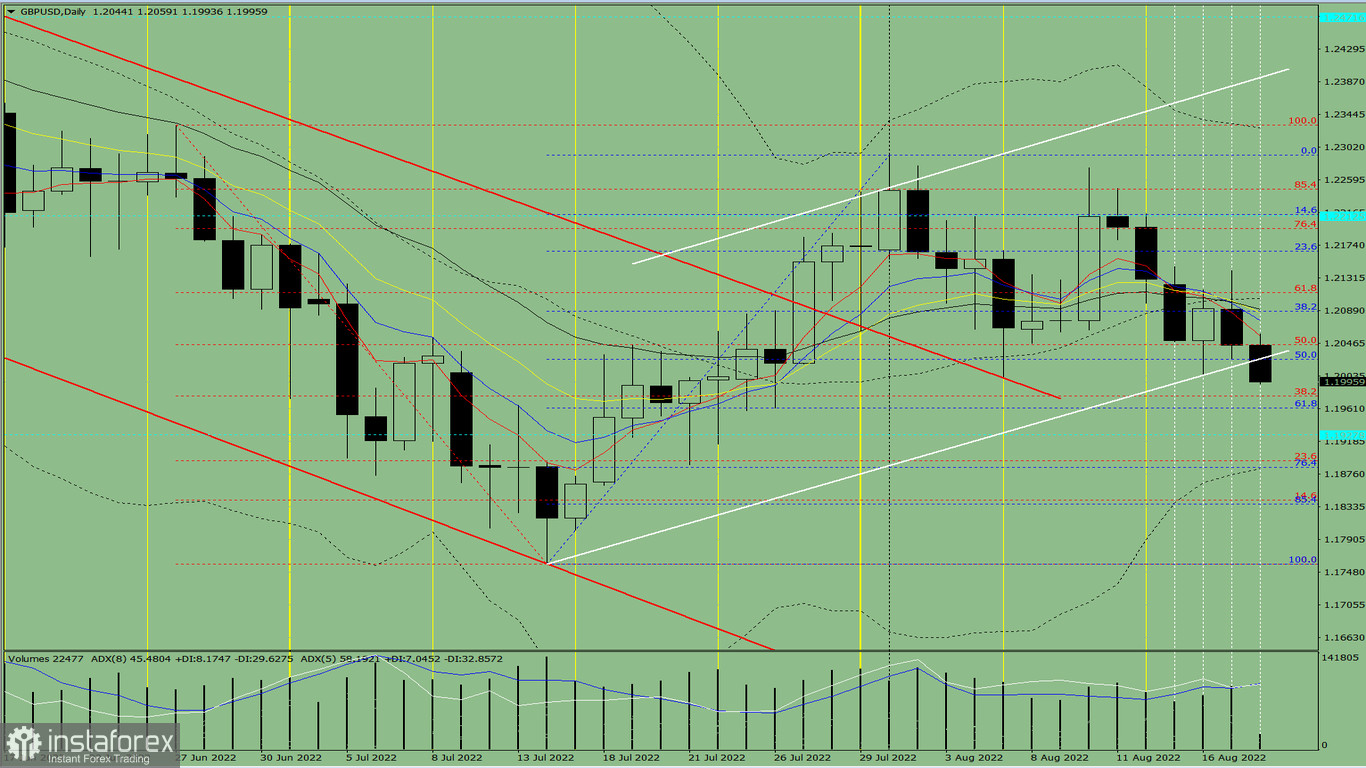
Fig. 1 (daily chart)
Comprehensive analysis:
Indicator analysis - downtrend
Fibonacci levels - downtrend
Volumes - downtrend
Candlestick analysis - downtrend
Trend analysis - uptrend
Bollinger bands - downtrend
Weekly chart - downtrend
Conclusion: GBP/USD will fall from 1.2044 (closing of yesterday's daily candle) to the 61.8% retracement level at 1.1962 (dashed blue line), then bounce up to the 50.0% retracement level at 1.2044 (red dotted line) and higher price levels.
Alternatively, the pair could move down from 1.2044 (closing of yesterday's daily candle) to the historical support level of 1.1928 (blue dotted line), then return to the 50.0% retracement level at 1.2044 (red dotted line). Price will continue to increase after these movements.
InstaForex analytical reviews will make you fully aware of market trends! Being an InstaForex client, you are provided with a large number of free services for efficient trading.


