 Stay
Stay 
Trading Conditions
Products
Tools


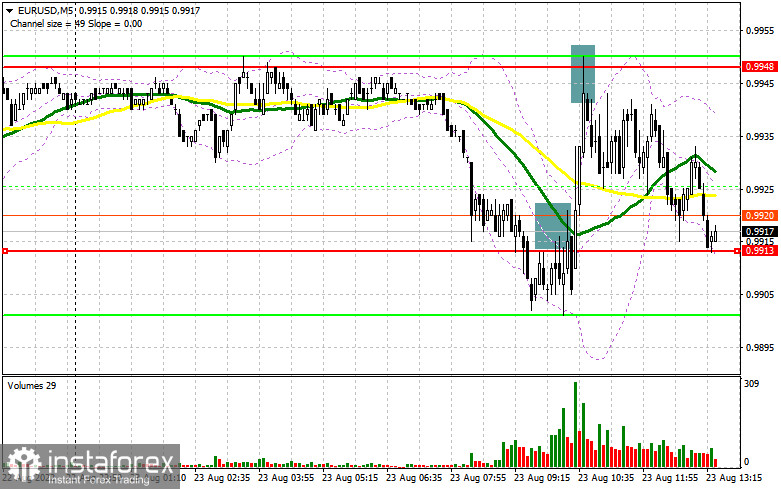
In the morning article, I highlighted the level of 0.9913 and recommended making decisions with this level in focus. Now, let's look at the 5-minute chart and try to figure out what actually happened. Traders digested the weak PMI indices for the eurozone. At first glance, a breakout below 0.9913 and an upward test gave a good sell signal within the trend. However, the PMI indexes for the eurozone turned out to be better than expected. As a result, a new large drop did not occur. Traders had to close short positions. A rise and a false breakout of 0.9948 provided a sell signal. At the time of writing the article, the pair went down by about 30 pips.
What is needed to open long positions on EUR/USD
In the American session, the US PMI indices are on tap. They could stir up market volatility. The euro may rise if the US PMI Manufacturing and Services indices, especially housing sales data, are downbeat. Therefore, it is recommended to pay attention to a new resistance level of 0.9941. In case of a further decline, which also looks likely given a strong bearish trend, only a false breakout of a new support level of 0.9903 will give a new buy signal. It will open the way to the nearest resistance level of 0.9941 formed in the first half of the day. A breakout and a downward test of this level will force the bears to close their Stop-Loss orders. If so, an additional buy signal will appear with the possibility of correction to 0.9980. At this level, the moving averages are passing in the negative territory. A more distant target will be the resistance level of 1.0017 where I recommend locking in profits. If EUR/USD declines and the bulls show no activity at 0.9903 in the afternoon, the pressure on the pair will escalate. The best option for opening long positions will be a false breakout near the new yearly low of 0.9861. You can buy EUR/USD immediately at a bounce from 0.9830 or a low of 0.9801, keeping in mind an upward intraday correction of 30-35 pips.
What is needed to open short positions on EUR/USD
The bulls took advantage of the situation but they failed to start a large correction in the morning. In the afternoon, the US macro stats will be in the limelight. It is quite important to monitor market reaction after their release. If the pair moves against expectations, namely the US dollar drops amid strong figures, it will signal the formation of an upward correction for the pair. In this case, it is better to postpone short positions. Therefore, the main task of the bears in the American session is to protect the new resistance level of 0.9941, formed in the first half of the day. The optimal scenario for opening short positions will be a false breakout of this level. It will push the euro down to 0.9903. The pair is likely to decline below this level if PMI data is strong. It makes no sense to go against the bear market without significant fundamental reasons. An upward test of 0.9903 will generate an additional sell signal. The price could sink to 0.9861 where I recommend locking in profits. A more distant target will be the 0.9930 level. If EUR/USD rises in the afternoon and the bears show no energy at 0.9941, the sentiment may become more bullish. In this case, it is better to postpone short positions to a false breakout of 0.9980. You can sell EUR/USD immediately at a bounce from 1.0017 or a high of 1.0054, keeping in mind a downward intraday correction of 30-35 pips.
COT report
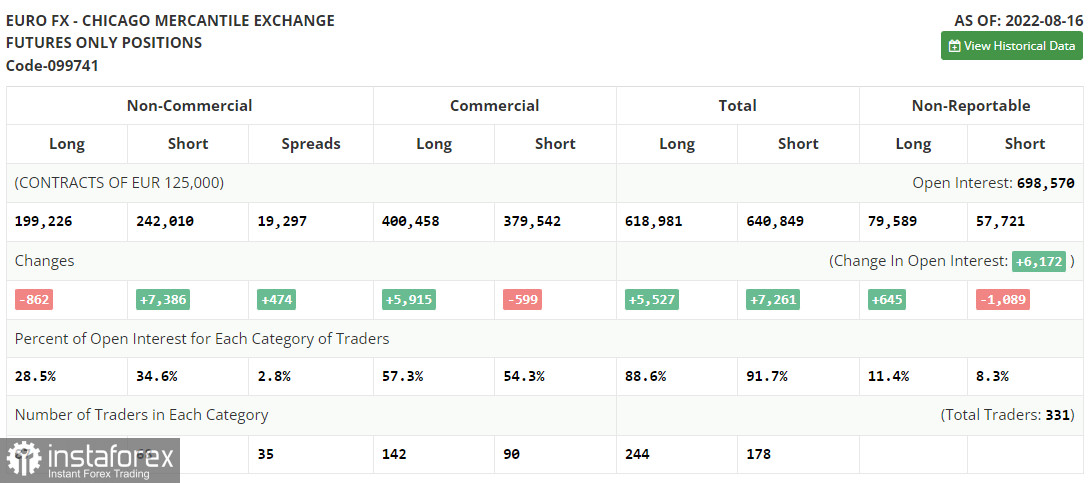
The COT report (Commitment of Traders) for August 16 logged a sharp increase in short positions and a drop in long ones, which clearly reflects the current trajectory of the euro against the US dollar. Apart from the risk of an impending recession in the US, traders are now also worried about dismal economic conditions in the eurozone. The economic woes may start this autumn due to a sharp rise in energy prices and soaring inflation. The European Central Bank is still very cautious when making monetary policy decisions to curb inflation. At the end of this month, the Jackson Hole Economic Symposium will take place. Fed Chairman Jerome Powell is scheduled to deliver a speech. His remarks are sure to determine a further trajectory of the pair. The strong US dollar hurts the economy and boosts inflation which the central bank is desperately trying to take under control. The COT report revealed that the number of long non-commercial positions decreased by 862 to 199,226, while the number of short non-commercial positions jumped by 7,386 to 242,010. At the end of the week, the total non-commercial net position remained negative and declined to -42,784 against -34,536, which indicates a return of bearish pressure on the euro and a further fall. The weekly closing price tumbled to 1.0191 against 1.0233.
Signals of technical indicators
Moving averages
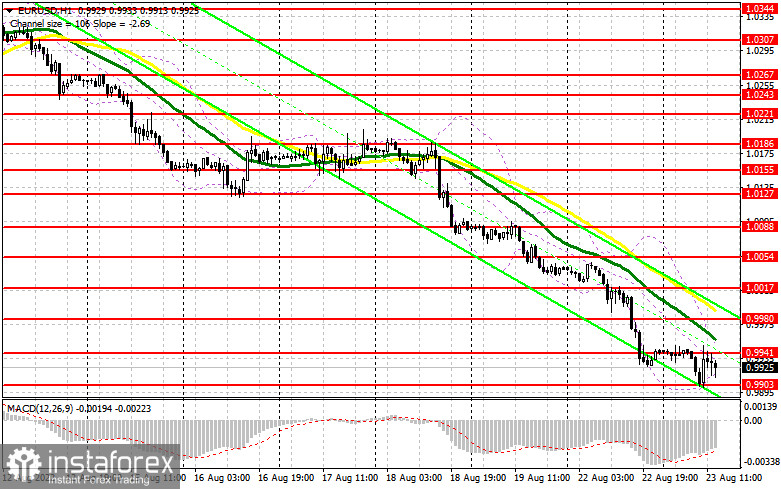
EUR/USD is trading below 30- and 50-period moving averages, signaling a further decline in the euro.
Remark. The author is analyzing the period and prices of moving averages on the 1-hour chart. So, it differs from the common definition of classic daily moving averages on the daily chart.
Bollinger Bands
In case of a rise, the upper border of 0.9950 will act as resistance.
Definitions of technical indicators
InstaForex analytical reviews will make you fully aware of market trends! Being an InstaForex client, you are provided with a large number of free services for efficient trading.


