 Stay
Stay 
Trading Conditions
Products
Tools


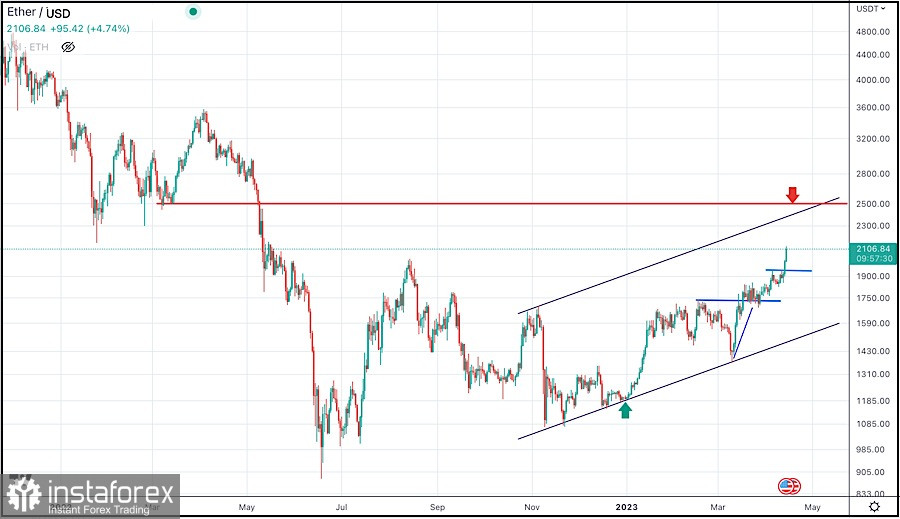
Ethereum has been one of the best-performing cryptocurrencies in the market, with significant gains since the beginning of the year. The recent technical analysis of the Ethereum/USD chart shows a potential bullish trend in the near future.
The updated technical analysis of the Ethereum/USD chart indicates that Ethereum has broken out of a key resistance level against USD, which could lead to further gains.
The cryptocurrency is trading within an ascending channel on the USD chart, signaling a potential bullish move.
Ethereum is trading above its 50-day moving average, indicating a bullish trend. However, the Relative Strength Index (RSI) is approaching overbought levels, which indicates a potential correction.
Hence, Ethereum may experience a pullback before continuing its upward trend against USD.
Traders should keep an eye on the price action around the 2500$ level, as it is a key resistance level. A break above this level could lead to further gains towards the 3000$ level. Conversely, a break below the 2000 $ support level could lead to a short-term bearish trend.
In summary, Ethereum against USD chart points to further continuation of the ongoing bullish trend, with a key resistance level at 2500.
Traders should be cautious and wait for confirmation of the bullish trend before entering any long positions.
InstaForex analytical reviews will make you fully aware of market trends! Being an InstaForex client, you are provided with a large number of free services for efficient trading.


