 Stay
Stay 
Trading Conditions
Products
Tools


The GBP/USD currency pair did not become like the euro and continued to fall on Tuesday. So the 2-year lows have been updated again, and the price came close to the level of 1.1600. The descending trend line remains relevant, so we have every reason to expect a continuation of the downward march. The lines of the Ichimoku indicator also remain relevant and strong. Macroeconomic and fundamental backgrounds were absent on Tuesday, however, this did not become a hindrance for traders. In fact, it's even a little strange to watch the pound fall and the euro not, because lately it has often been the other way around. In general, both pairs have shown an enviable correlation with each other in recent months. Now, when there are no important events and reports... Nevertheless, even for the euro, the long-term downward trend persists. Therefore, both European currencies may continue to fall for the same reasons as before.
With trading signals for the pound, things were better than for the euro, because the movement was in a trend for most of the day. The first buy signal was formed when the extreme level of 1.1716 was overcome and after that the price moved in the right direction for 30 points. It was unable to reach the critical line, so the deal was most likely closed by Stop Loss at breakeven. Then another buy signal was formed near the level of 1.1716, which also turned out to be false, and this time the price could not go up even 20 points, so Stop Loss could not be set. Two false signals - therefore, the third and fourth signals near the level of 1.1716 should not have been worked out. And it was these signals that turned out to be profitable. Thus, the trend movement in the pound remains, but its character is very much like the same "swing". The pound now also needs to be traded very carefully.
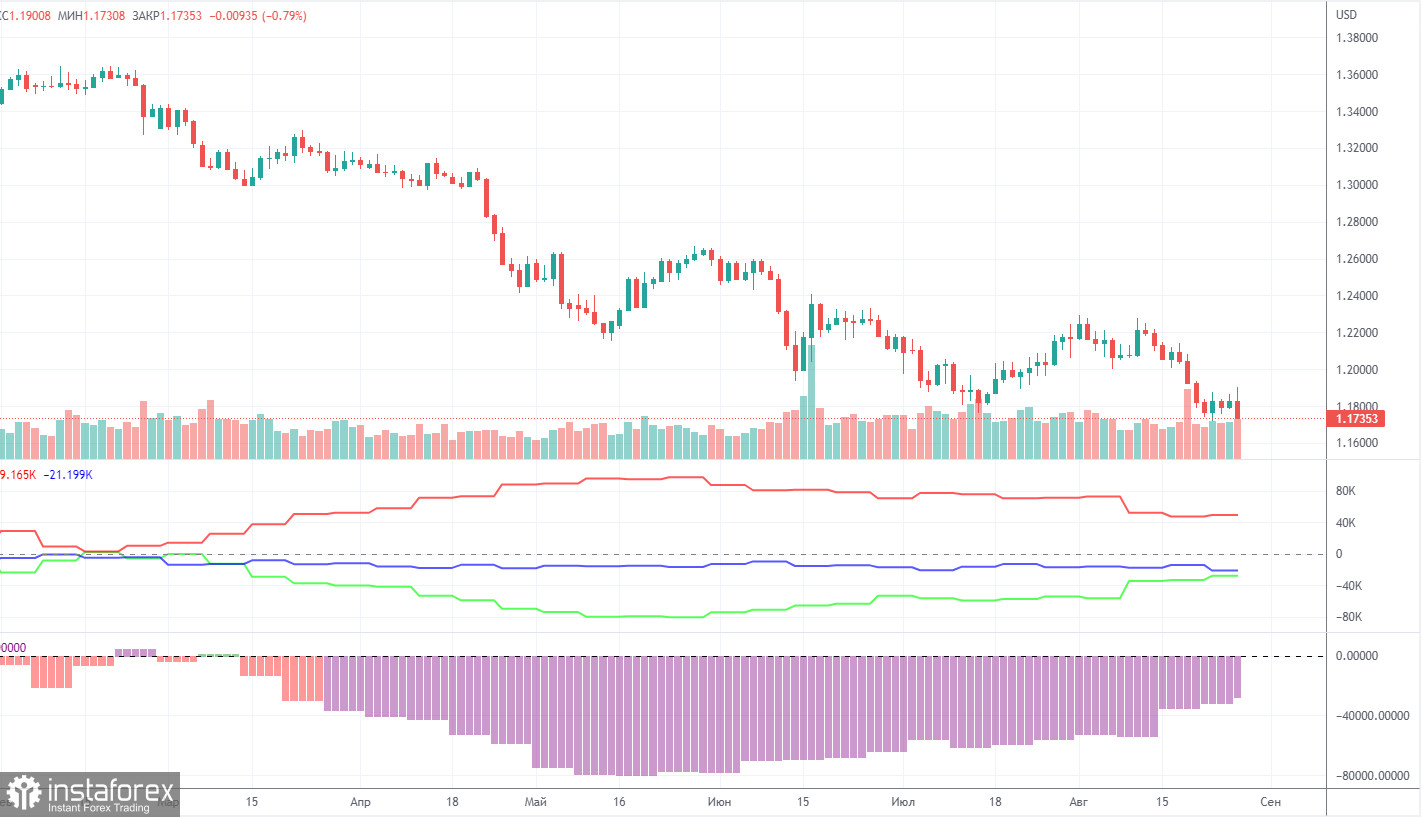
The latest Commitment of Traders (COT) report on the British pound turned out to be quite interesting. During the week, the non-commercial group opened 14,700 long positions and 9,500 short positions. Thus, the net position of non-commercial traders increased immediately by 5,200. Despite the growth of this indicator for several months now, the mood of the big players still remains "pronounced bearish", which is clearly seen in the second indicator in the chart above (purple bars below zero = bearish mood). To be fair, in recent months the net position of the non-commercial group has been constantly growing, but the pound shows only a very weak tendency to rise. And even then, only from time to time. And now its fall has resumed altogether, so the bearish mood of major players may again begin to intensify in the near future. The non-commercial group now has a total of 86,000 short positions and 58,000 long positions open. The difference is no longer as daunting as it was a few months ago, but it's still there. The net position will have to show growth for a long time to at least equalize these figures. Moreover, COT reports are a reflection of the mood of major players, and their mood is influenced by the "foundation" and geopolitics. If they continue to be as disappointing as they are now, then the pound may still be on the "downward peak" for a long time. We should also remember that the demand for the pound is not the only thing that matters, but also the demand for the dollar, which seems to remain very strong. Therefore, even if the demand for the British currency grows, if the demand for the dollar grows at a higher rate, then the pound will not strengthen.
Overview of the EUR/USD pair. August 31. The ECB has woken up and is uncovering its weapon against inflation.
Overview of the GBP/USD pair. August 31. Britain needs investment and tax cuts.
Forecast and trading signals for EUR/USD on August 31. Detailed analysis of the movement of the pair and trading transactions.
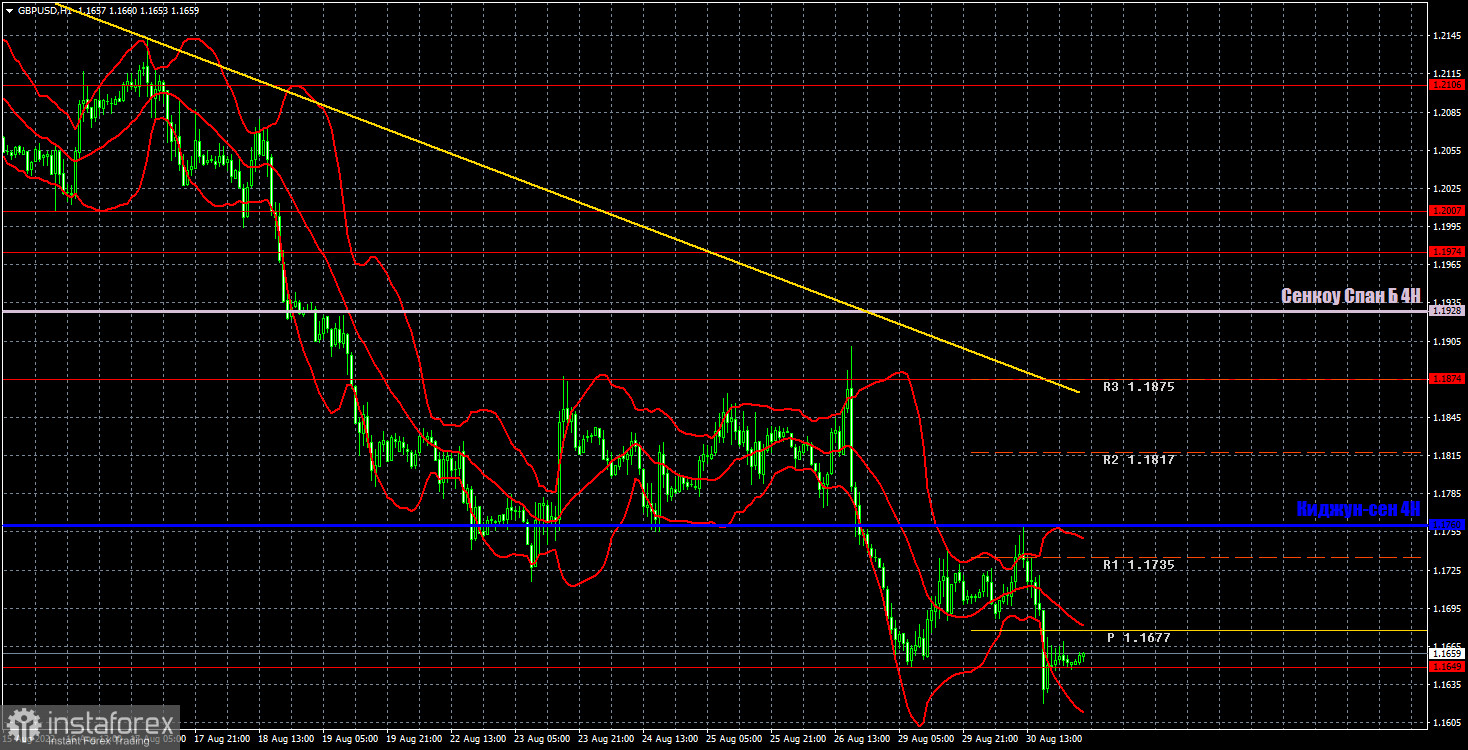
The pound/dollar pair maintains a downward trend thanks to the trend line on the hourly timeframe. After a slight upward rollback, the British currency resumed to fall and may continue for some time. However, we warn that the probability of "swing" is now high, so you need to trade very carefully. We highlight the following important levels for August 31: 1.1649, 1.1874, 1.1974, 1.2007. The Senkou Span B (1.1928) and Kijun-sen (1.1760) lines can also be sources of signals. Signals can be "rebounds" and "breakthroughs" of these levels and lines. The Stop Loss level is recommended to be set to breakeven when the price passes in the right direction by 20 points. Ichimoku indicator lines can move during the day, which should be taken into account when determining trading signals. The chart also contains support and resistance levels that can be used to take profits on trades. There are no interesting events planned for Wednesday in the UK, and only a completely minor ADP report will be released in the US. Thus, traders will again have nothing to react to, but now the pound does not need the market to react to anything. It's doing great without it.
Support and Resistance Levels are the levels that serve as targets when buying or selling the pair. You can place Take Profit near these levels.
Kijun-sen and Senkou Span B lines are lines of the Ichimoku indicator transferred to the hourly timeframe from the 4-hour one.
Support and resistance areas are areas from which the price has repeatedly rebounded off.
Yellow lines are trend lines, trend channels and any other technical patterns.
Indicator 1 on the COT charts is the size of the net position of each category of traders.
Indicator 2 on the COT charts is the size of the net position for the non-commercial group.
InstaForex analytical reviews will make you fully aware of market trends! Being an InstaForex client, you are provided with a large number of free services for efficient trading.


