 Stay
Stay 
Trading Conditions
Products
Tools


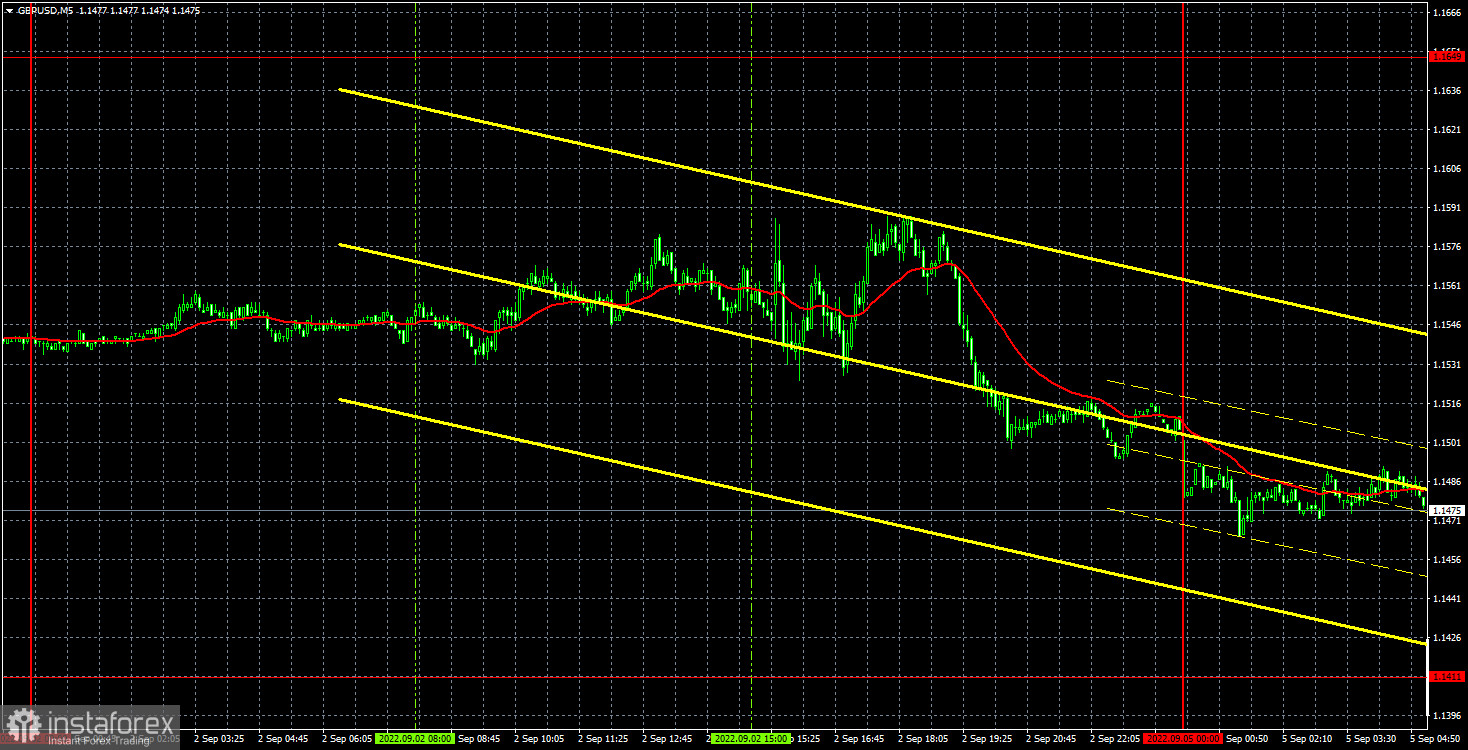
The GBP/USD currency pair continued its downward movement on Friday as a whole. In the first half of the day, as well as for the euro, an upward correction was observed, and in the second, the fall resumed. The euro has been trading sideways for more than two weeks, while the pound has continued to fall almost precipitously all this time. At the moment, only 65 points remain to go to 37-year lows, and the quotes do not stop falling even at night. On Friday, as we have already said, there were grounds for a new growth of the US currency. The statistics from overseas may not be the best, but what's the difference if the pound continues to fall anyway? During the last week there were quite few reports, but traders still continued to sell the pair! And on Friday, it turns out that traders also had clear reasons for selling the pound. Thus, the lows for almost four decades will be updated this week, and it is rather difficult to even imagine how low the pound may eventually fall.
In regards to Friday's trading signals, everything was as simple as possible, since there were none. Despite the fact that the movements were quite volatile, the price never approached any level or line, so no signals were formed. We have already said that the pound is now so low that there are simply no levels in this price area, and the Ichimoku indicator lines are located much above the price and simply do not keep up with it down. Therefore, over time, levels will appear, but so far they are not.
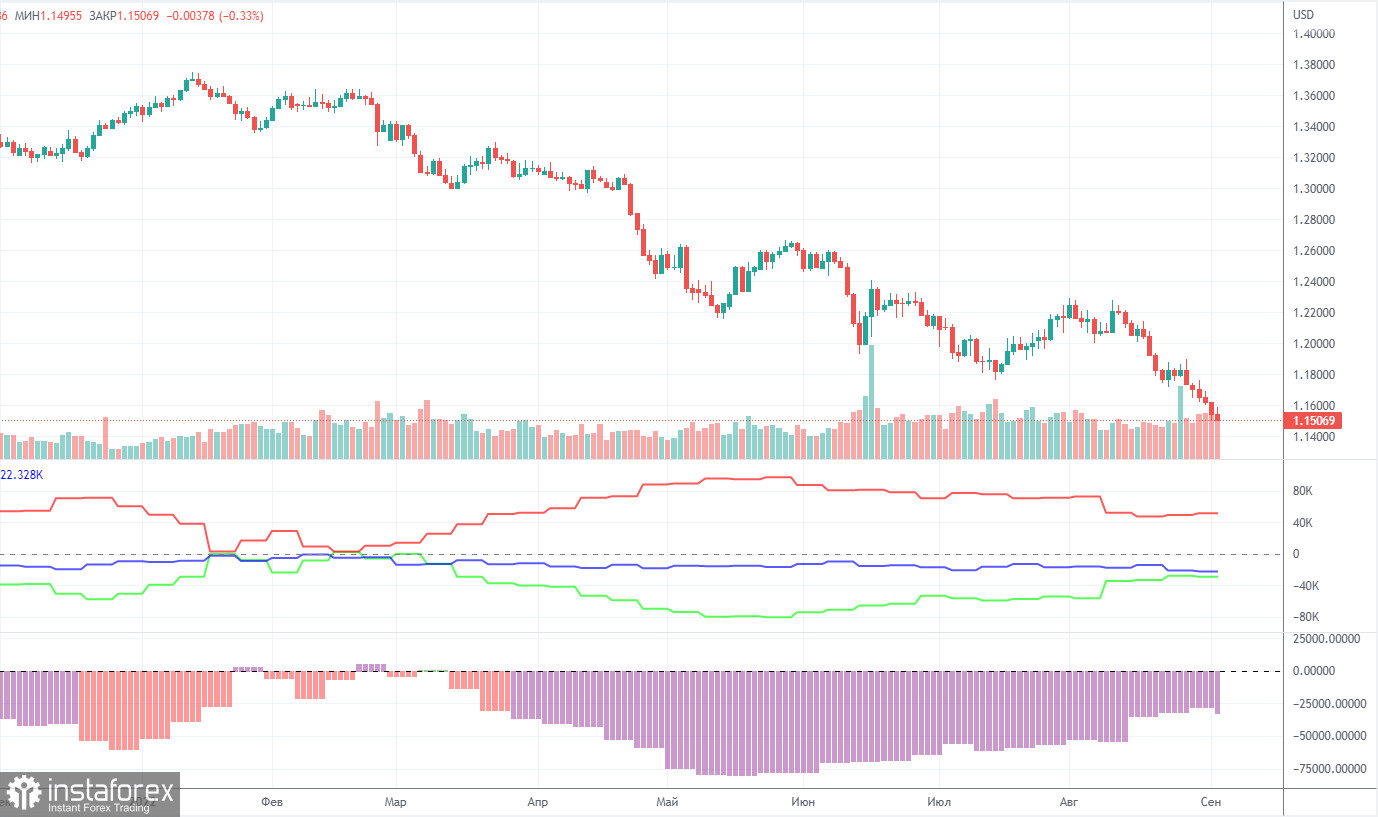
The latest Commitment of Traders (COT) report on the British pound, released yesterday, turned out to be as neutral as possible. During the week, the non-commercial group closed 300 long positions and opened 900 short positions. Thus, the net position of non-commercial traders immediately increased by 1,200. The net position indicator has been growing for several months, but the mood of the big players still remains "pronounced bearish", which is clearly seen in the second indicator in the chart above (purple bars below zero = bearish mood). Therefore, the growth of the British pound still cannot count. How can you count on it if the market sells the pound more than it buys? And now its fall has resumed altogether, so the bearish mood of major players in the near future can only intensify. The non-commercial group now has a total of 87,000 shorts and 58,000 longs open. The difference is not as terrifying as it was a few months ago, but it is still noticeable. The net position will have to show growth for a long time to at least equalize these figures. Moreover, COT reports are a reflection of the mood of major players, and their mood is influenced by the "foundation" and geopolitics. If they remain as weak as they are now, then the pound may still be in a "downward peak" for some time. Also remember that it is not only the demand for the pound that matters, but also the demand for the dollar, which seems to remain very strong. Therefore, even if the demand for the British currency grows, if the demand for the dollar grows at a higher rate, then we will not see the strengthening of the pound.
Forecast and trading signals for EUR/USD on September 5. Detailed analysis of the movement of the pair and trading transactions.
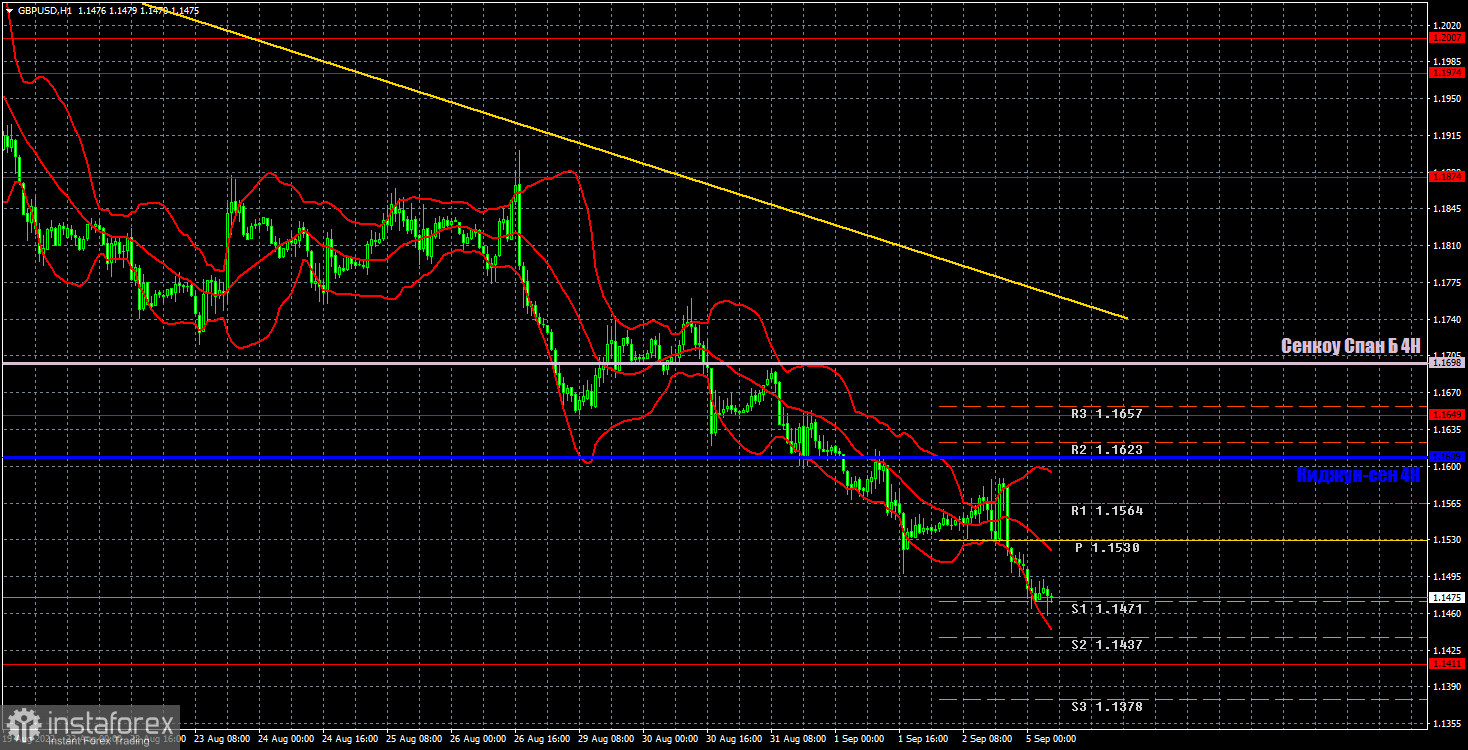
The pound/dollar pair maintains a downward trend on the hourly timeframe thanks to the trend line. The British currency continues to fall and may continue for some time, as the market seems to have forgotten that you can not only press the sell button. The market does not need any specific grounds for trading now, and the pound is updating its local lows almost every day. We highlight the following important levels on September 5: 1.1411, 1.1649, 1.1874, 1.1974, 1.2007. Senkou Span B (1.1698) and Kijun-sen (1.1609) lines can also be sources of signals. Signals can be "rebounds" and "breakthroughs" of these levels and lines. The Stop Loss level is recommended to be set to breakeven when the price passes in the right direction by 20 points. Ichimoku indicator lines can move during the day, which should be taken into account when determining trading signals. The chart also contains support and resistance levels that can be used to take profits on trades. The index of business activity in the services sector in the second assessment for August will be released on Monday in the UK - far from the most significant report in the current circumstances, when the pound is falling every day. Meanwhile, there is nothing interesting planned for today in the US. There will be nothing for traders to react during the day.
Support and Resistance Levels are the levels that serve as targets when buying or selling the pair. You can place Take Profit near these levels.
Kijun-sen and Senkou Span B lines are lines of the Ichimoku indicator transferred to the hourly timeframe from the 4-hour one.
Support and resistance areas are areas from which the price has repeatedly rebounded off.
Yellow lines are trend lines, trend channels and any other technical patterns.
Indicator 1 on the COT charts is the size of the net position of each category of traders.
Indicator 2 on the COT charts is the size of the net position for the non-commercial group.
InstaForex analytical reviews will make you fully aware of market trends! Being an InstaForex client, you are provided with a large number of free services for efficient trading.

