 Stay
Stay 
Trading Conditions
Products
Tools


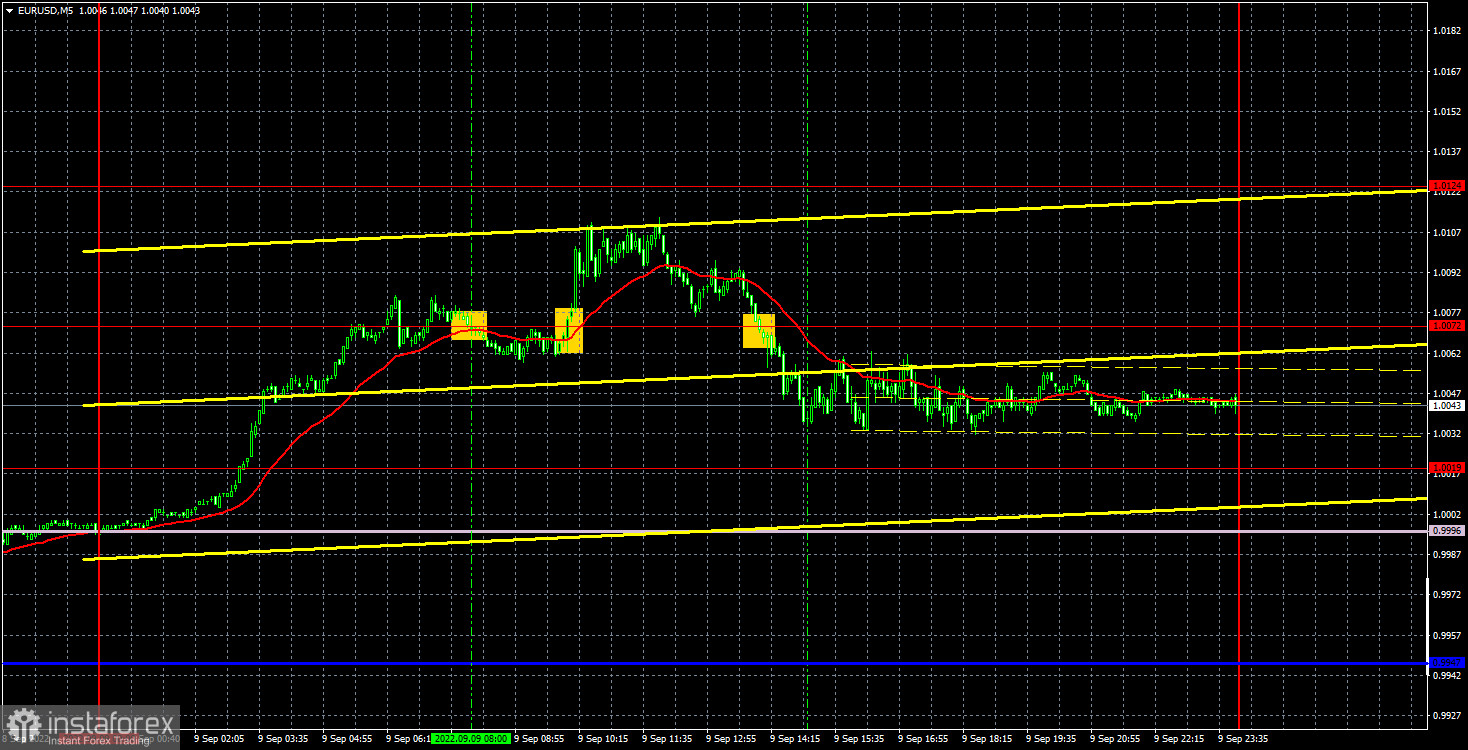
The EUR/USD pair was trading rather calmly on Friday. Weekly highs have been updated, but the euro remains quite low, near its 20-year lows. Thus, it is still very early to talk about the end of the downward trend. By and large, the pair continues to ride the "swing". It went above the level of 1.0072 for a short time, which, we recall, is considered the upper boundary of the horizontal channel, but by the end of the day it returned to the area below it. Therefore, for the time being, we see no compelling technical reasons to expect further growth. But there are certain fundamental reasons. Last week, the European Central Bank raised the rate by another 0.75%, so the fundamental component is starting to improve for the euro. Indeed, this moment may not help, as the Bank of England raised rates six times, and the pound hit its 37-year lows in response. There were no important statistics or events either in the European Union or in the US on Friday, so traders had nothing to react to during the day.
As for trading signals, there were only three of them during the day. First, the pair settled below the level of 1.0072, but this signal turned out to be false and one could receive a loss on it. The next signal was formed on a consolidation above 1.0072, but it should not have been worked out, since the candle on which the signal was formed was very strong and the price almost immediately approached the target level of 1.0124. The third sell signal was not strong, but it made it possible for us to make some money and cover the morning loss. The short position had to be closed manually in the late afternoon.
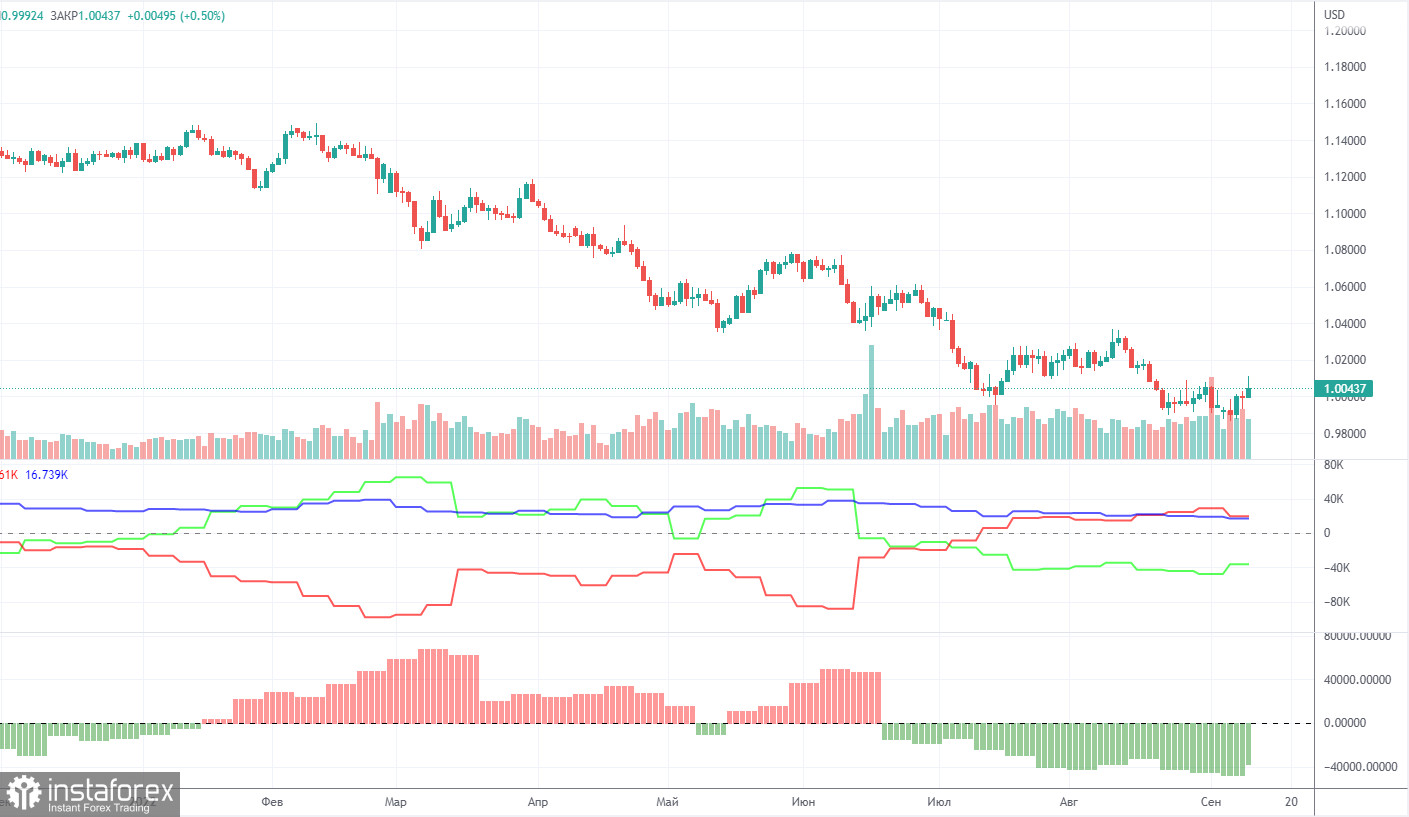
The Commitment of Traders (COT) reports on the euro in the last few months clearly reflect what is happening in the euro/dollar pair. For half of 2022, they showed a blatant bullish mood of commercial players, but at the same time, the euro fell steadily. At this time, the situation is different, but it is NOT in favor of the euro. If earlier the mood was bullish, and the euro was falling, now the mood is bearish and... the euro is also falling. Therefore, for the time being, we do not see any grounds for the euro's growth, because the vast majority of factors remain against it. During the reporting week, the number of long positions for the non-commercial group increased by 3,000, while the number of shorts decreased by 8,300. Accordingly, the net position grew by about 12,000 contracts. This is not very much, but it is still a weakening of the bearish mood among the major players. However, this fact is not of particular importance, since the mood still remains bearish, and the euro remains "at the bottom". At this time, commercial traders still do not believe in the euro. The number of longs is lower than the number of shorts for non-commercial traders by 36,000. Therefore, we can state that not only does the demand for the US dollar remain high, but that the demand for the euro is also quite low. The fact that major players are in no hurry to buy the euro may lead to a new depreciation of this currency. Over the past six months or a year, the euro has not been able to show even a tangible correction.
Overview of the EUR/USD pair. September 12. European inflation and the speeches of the ECB representatives.
Overview of the GBP/USD pair. September 12. Inflation in the UK, inflation in the US... it's going to be an interesting week!
Forecast and trading signals for GBP/USD on September 12. Detailed analysis of the movement of the pair and trading transactions.
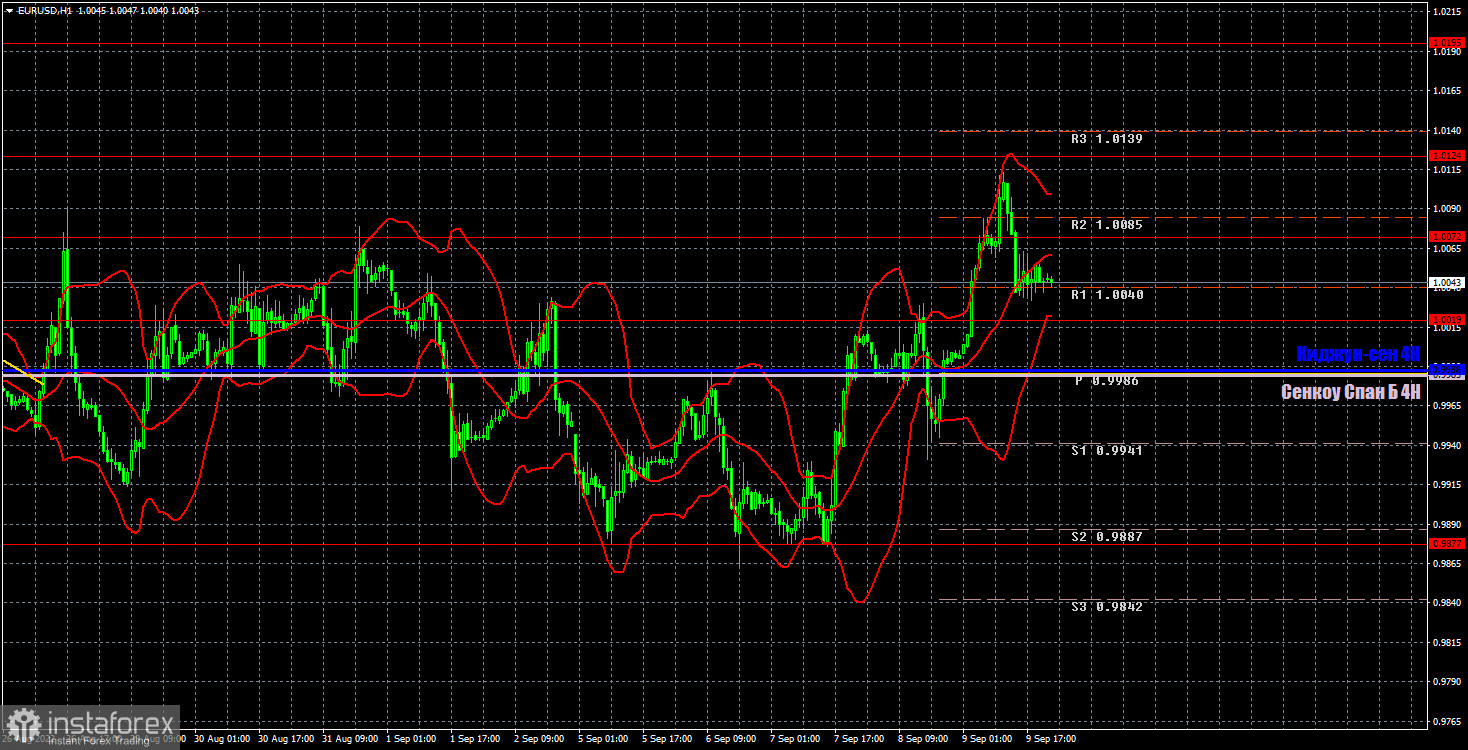
The pair continues to trade on the hourly timeframe in a mode very similar to the swing. The price tried to leave the horizontal channel, but at the moment it cannot be said that it succeeded. Thus, in the new week, we may well see a new round of downward movement with a target of 0.9877. We highlight the following levels for trading on Monday - 0.9877, 1.0019, 1.0072, 1.0124, 1.0195, 1.0269, as well as Senkou Span B (0.9985) and Kijun-sen (0 .9988). There is still no level below 0.9877, so there is simply nothing to trade there. Ichimoku indicator lines can move during the day, which should be taken into account when determining trading signals. There are also secondary support and resistance levels, but no signals are formed near them. Signals can be "rebounds" and "breakthrough" extreme levels and lines. Do not forget about placing a Stop Loss order at breakeven if the price has gone in the right direction for 15 points. This will protect you against possible losses if the signal turns out to be false. Among the important events on September 12, we can single out only the speeches of ECB members Schnabel and de Guindos. Perhaps they will provide important information to the market regarding rates and monetary policy.
Support and Resistance Levels are the levels that serve as targets when buying or selling the pair. You can place Take Profit near these levels.
Kijun-sen and Senkou Span B lines are lines of the Ichimoku indicator transferred to the hourly timeframe from the 4-hour one.
Support and resistance areas are areas from which the price has repeatedly rebounded off.
Yellow lines are trend lines, trend channels and any other technical patterns.
Indicator 1 on the COT charts is the size of the net position of each category of traders.
Indicator 2 on the COT charts is the size of the net position for the non-commercial group.
InstaForex analytical reviews will make you fully aware of market trends! Being an InstaForex client, you are provided with a large number of free services for efficient trading.


