 Stay
Stay 
Trading Conditions
Products
Tools


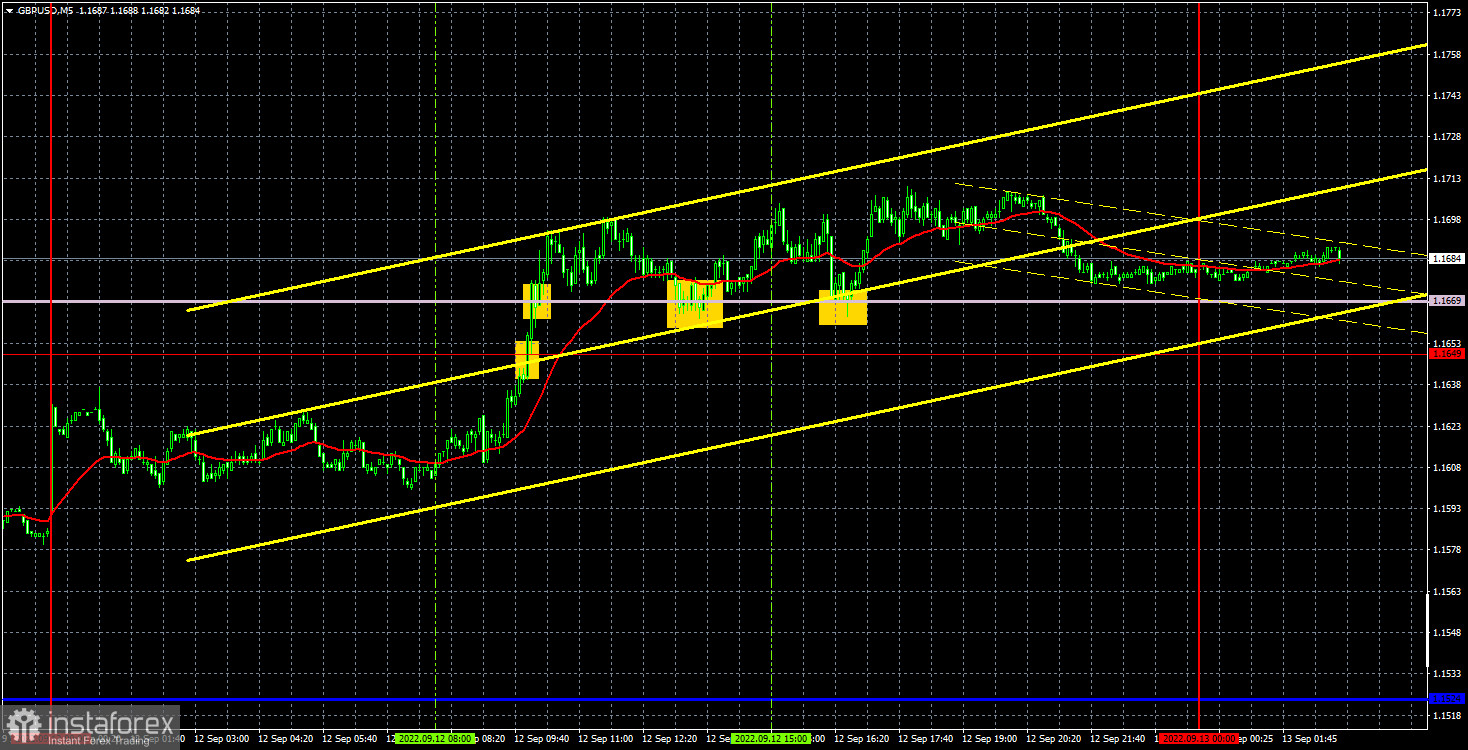
The GBP/USD currency pair also continued its upward movement on Monday, and even managed without a correction in the afternoon. The European Central Bank meeting had nothing to do with the British pound, so we consider the reasons for the pound's growth to be purely technical. The descending trend line has been broken, so we now have an upward trend at our disposal, and the price has broken the important Senkou Span B, which allows the pound to continue moving upward. It is difficult to say how long this movement will last, as it may be another round of technical correction within the global downward trend. So the pound can still fall. There were important statistics for the British currency on Monday. At least reports on GDP and industrial production were published. Their values were such that it was impossible to consider the reports as optimistic. Therefore, the growth of the British currency is definitely not related to these statistics, which further convinces us that the reasons are technical.
In regards to trading signals, the situation was worse. The first trading signal to buy was formed in the middle of the upward movement, and the level of 1.1649 and the Senkou Span B line should be considered as a solid area of resistance. Therefore, the first long position could be opened only after the Senkou Span B was overcome. After that, the pair bounced twice more from above this line, each time forming a buy signal. Consequently, traders could open three long positions, but the first two were closed by Stop Loss at breakeven (20 points each time the price went up). Only the third deal allowed traders to earn a couple of dozen points.
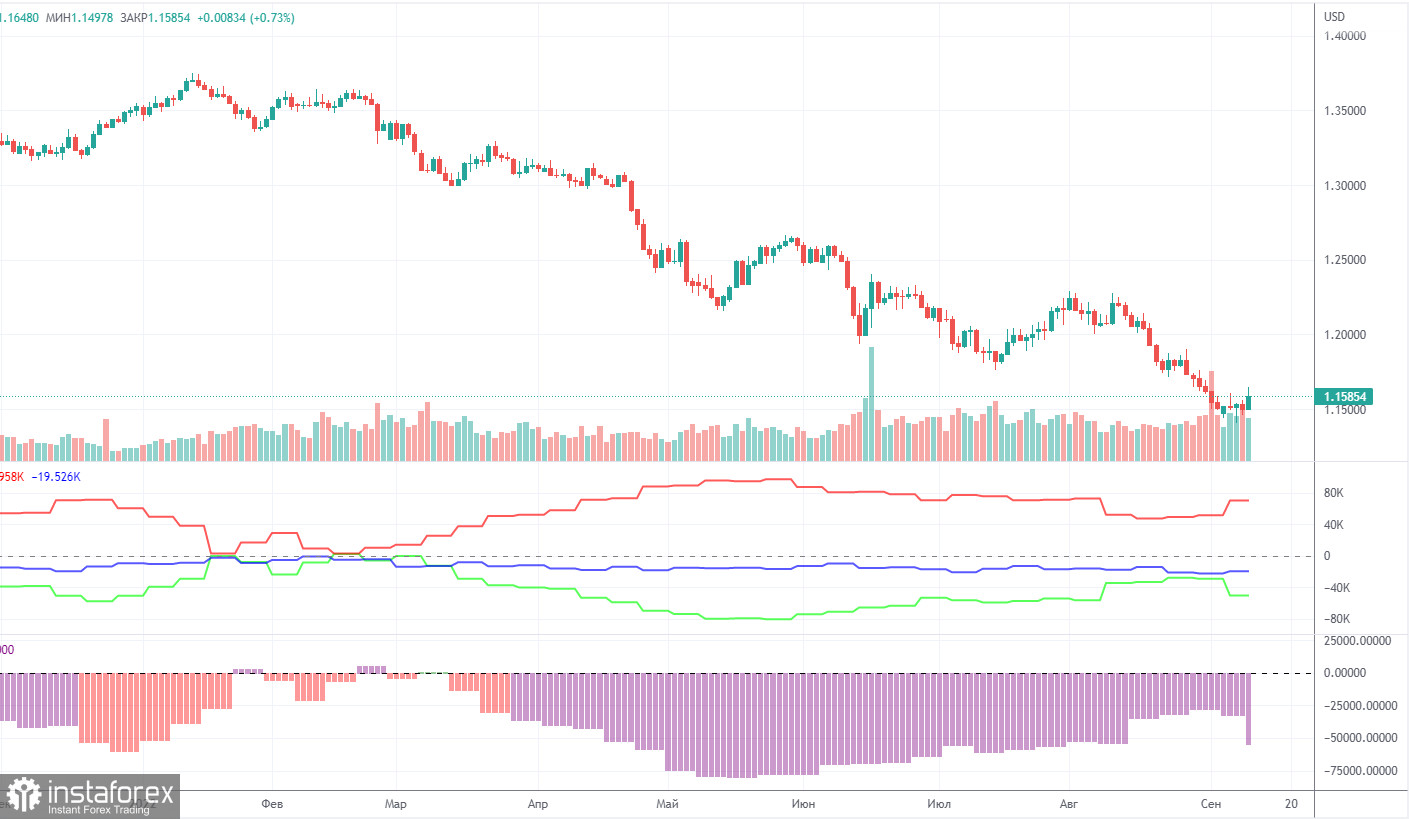
The latest Commitment of Traders (COT) report on the British pound released yesterday, was very eloquent. During the week, the non-commercial group closed 5,700 long positions and opened 15,500 short positions. Thus, the net position of non-commercial traders immediately fell by 21,100, which is a lot for the pound. The net position indicator has been growing for several months, but the mood of the big players still remains pronounced bearish, which is clearly seen in the second indicator in the chart above (purple bars below zero = bearish mood). And now it has begun a new fall, so the British pound still cannot count on a strong growth. How can you count on it if the market sells the pound more than it buys? And now its fall has resumed altogether, so the bearish mood of major players in the near future can only intensify. The non-commercial group now has a total of 103,000 shorts and 52,000 longs open. The difference is twofold. The net position will have to show growth for a long time to at least equalize these figures. Moreover, COT reports are a reflection of the mood of major players, and their mood is influenced by the foundation and geopolitics. If they remain the same as they are now, then the pound may still be in a "downward peak" for some time.
Overview of the EUR/USD pair. September 13. The euro is at a crossroads. Much will depend on inflation reports.
Overview of the GBP/USD pair. September 13. Liz Truss is the best candidate available, but may prove to be a weak prime minister.
Forecast and trading signals for EUR/USD on September 13. Detailed analysis of the movement of the pair and trading transactions.
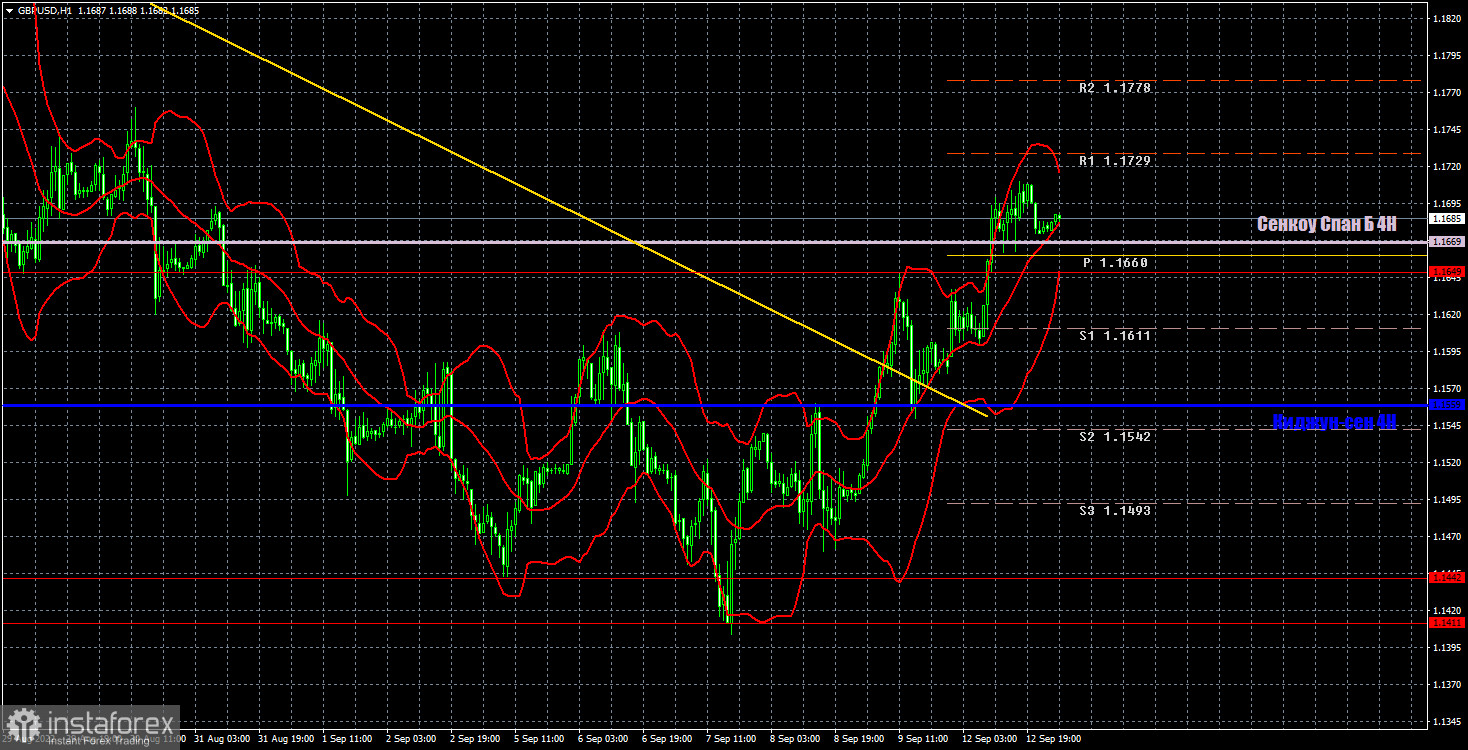
The pound/dollar pair has completed the downward trend on the hourly timeframe and is ready to hit the growth for a while. Traders were not interested in the latest British reports and most likely they will also not be interested on Tuesday. The reasons for the growth of the euro and the pound may be purely technical. We highlight the following important levels on September 13: 1.1411-1.1442, 1.1649, 1.1874. The Senkou Span B (1.1669) and Kijun-sen (1.1559) lines can also be sources of signals. Signals can be "rebounds" and "breakthroughs" of these levels and lines. The Stop Loss level is recommended to be set to breakeven when the price passes in the right direction by 20 points. Ichimoku indicator lines can move during the day, which should be taken into account when determining trading signals. The chart also contains support and resistance levels that can be used to take profits on trades. Relatively important data on unemployment, wages and jobless claims will be published in the UK on Tuesday, but the market reaction may be the same as yesterday. That is, none. However, today there will be a report on US inflation and a speech by Bank of England Chairman Andrew Bailey, which will undoubtedly interest traders much more than morning reports.
Support and Resistance Levels are the levels that serve as targets when buying or selling the pair. You can place Take Profit near these levels.
Kijun-sen and Senkou Span B lines are lines of the Ichimoku indicator transferred to the hourly timeframe from the 4-hour one.
Support and resistance areas are areas from which the price has repeatedly rebounded off.
Yellow lines are trend lines, trend channels and any other technical patterns.
Indicator 1 on the COT charts is the size of the net position of each category of traders.
Indicator 2 on the COT charts is the size of the net position for the non-commercial group.
InstaForex analytical reviews will make you fully aware of market trends! Being an InstaForex client, you are provided with a large number of free services for efficient trading.

