 Stay
Stay 
Trading Conditions
Products
Tools


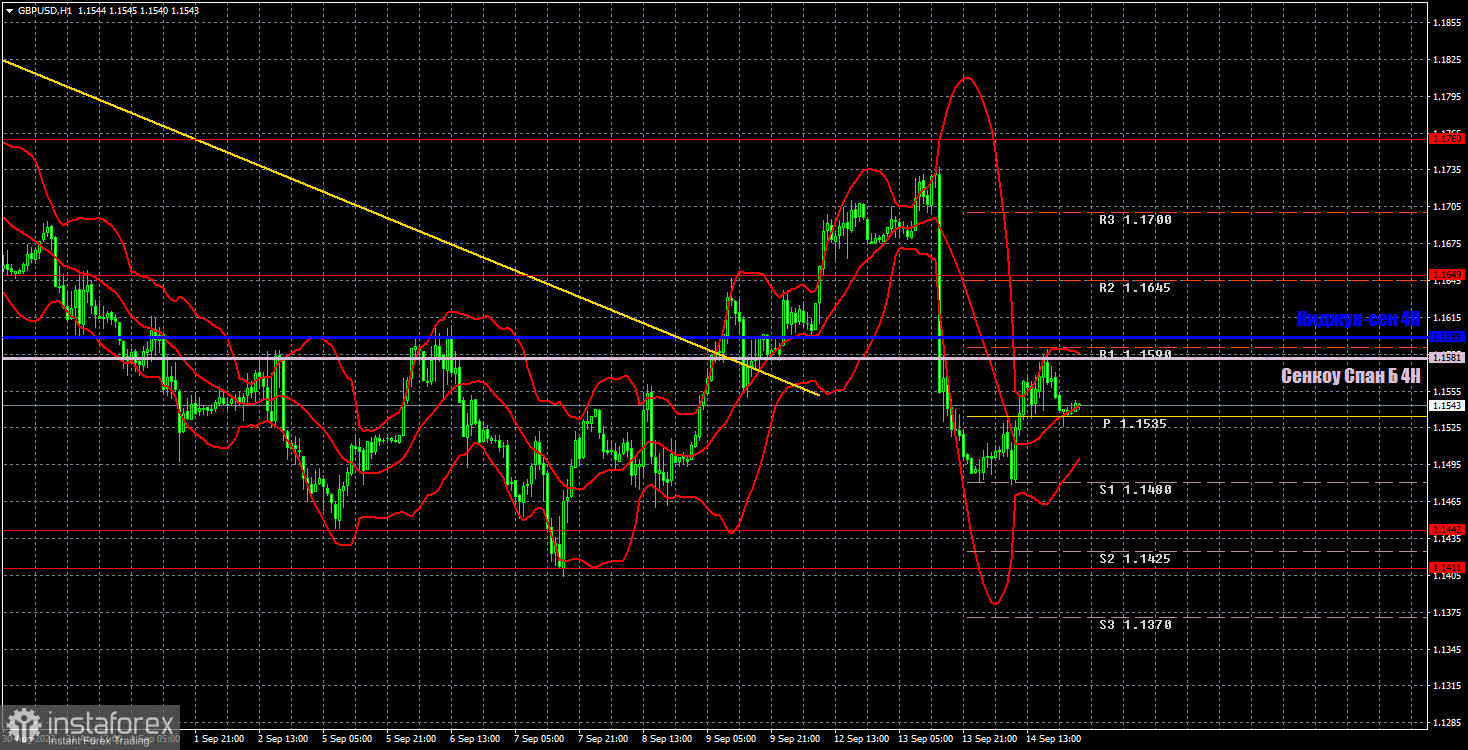
The GBP/USD currency pair traded as sluggishly as the EUR/USD pair on Wednesday. However, it should be noted that, unlike the euro, the pound had reason to show interesting movements. The UK inflation report for August was published in the morning, which, from our point of view, was much more unexpected than the US inflation report a day earlier. The British consumer price index fell from 10.1% to 9.9%, when everyone expected it to rise to the level of 10.6%. Everyone remembers that the Bank of England sets the maximum inflation rate for the next year and a half at 13-15%. Thus, an unexpected decline, of course, can be a banal accident, but the market practically did not react to this positive moment. Unless, of course, we do not consider the pound's decline by 25 points as a "reaction". This was followed by an upward reversal of the pair and for the rest of the day there was already an upward movement. By the end of the day, the pair was near the Ichimoku Kijun-sen and Senkou Span B indicator lines. Now the British currency's succeeding attempts will depend on whether it overcomes these lines or not. A rebound from any of them will provoke a new fall in the pound/dollar pair, which will now be more logical.
In regards to trading signals, things were as simple as possible - there were none. The pair did not even approach any level or line. The quotes rose to the critical line only in the evening, but never worked it out. Therefore, trade deals should not have been opened on Wednesday.
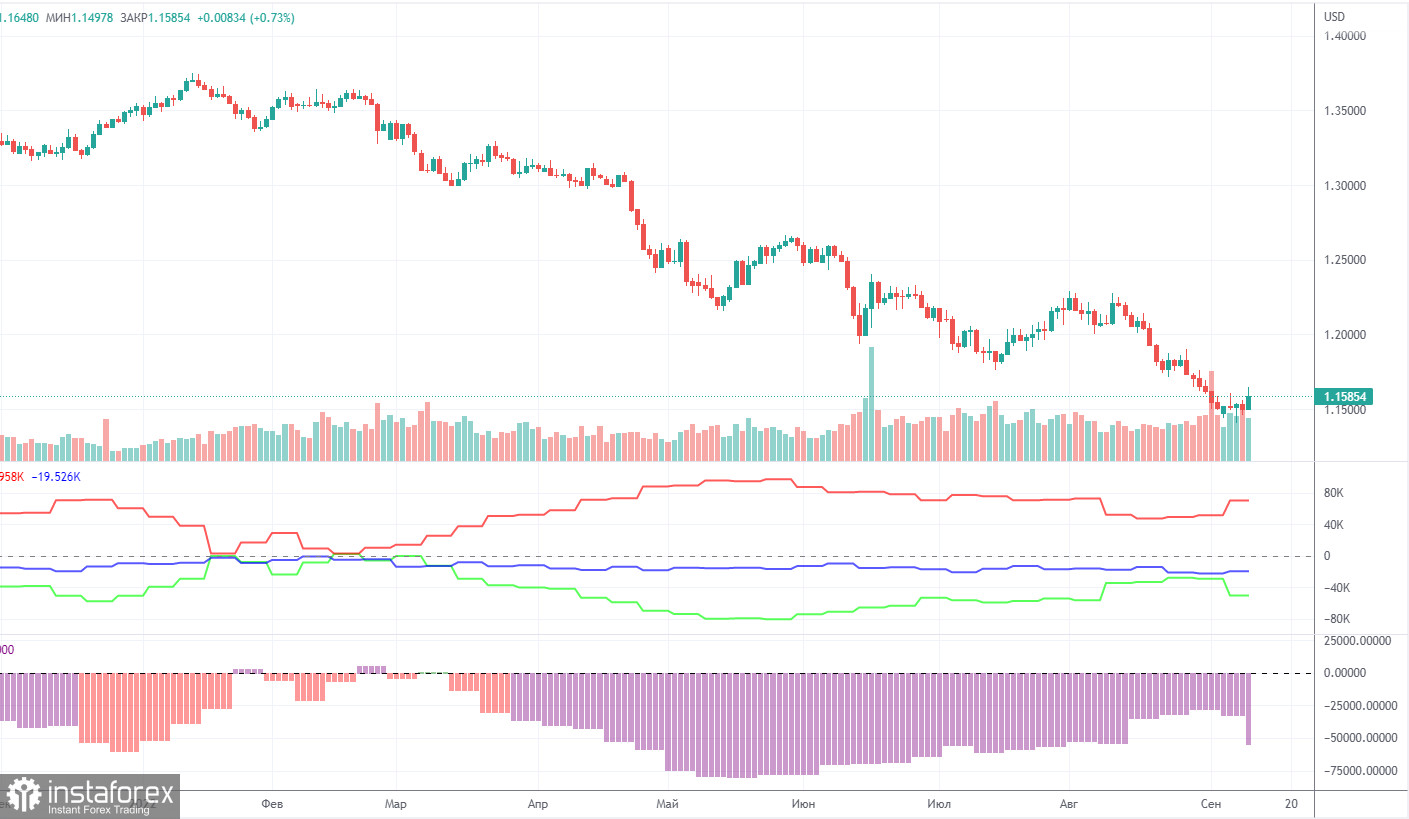
The latest Commitment of Traders (COT) report on the British pound, was very eloquent. During the week, the non-commercial group closed 5,700 long positions and opened 15,500 short positions. Thus, the net position of non-commercial traders immediately fell by 21,100, which is a lot for the pound. The net position indicator has been growing for several months, but the mood of the big players still remains pronounced bearish, which is clearly seen in the second indicator in the chart above (purple bars below zero = bearish mood). And now it has begun a new fall, so the British pound still cannot count on a strong growth. How can you count on it if the market sells the pound more than it buys? And now its fall has resumed altogether, so the bearish mood of major players in the near future can only intensify. The non-commercial group now has a total of 103,000 shorts and 52,000 longs open. The difference is twofold. The net position will have to show growth for a long time to at least equalize these figures. Moreover, COT reports are a reflection of the mood of major players, and their mood is influenced by the foundation and geopolitics. If they remain the same as they are now, then the pound may still be in a "downward peak" for some time.
Overview of the EUR/USD pair. September 15. The strengthening of the ECB's monetary mood no longer worries anyone. The Fed is once again occupying the minds of traders.
Overview of the GBP/USD pair. September 15. British inflation brought an unexpected, but expected, "surprise".
Forecast and trading signals for EUR/USD on September 15. Detailed analysis of the movement of the pair and trading transactions.
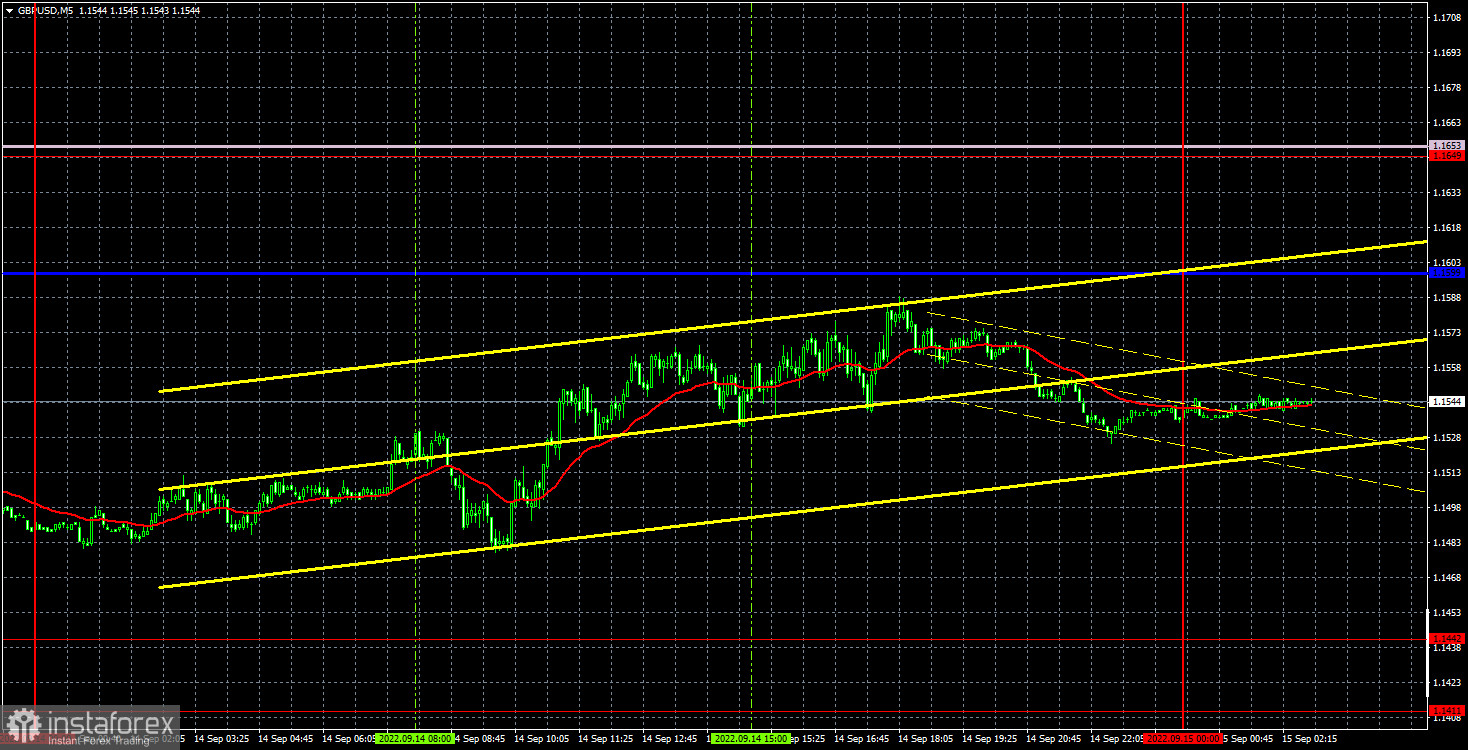
The pound/dollar pair has now completed an upward trend on the hourly timeframe. At least the price has already consolidated below all Ichimoku indicator lines, and all because of one US inflation report. The pair may now resume its long-term downward trend and renew 37-year lows several more times. The main thing for the bears now is to stay below the Senkou Span B line. In this case, the road to the downside will be open. We identify the following important levels on September 15: 1.1411-1.1442, 1.1649, 1.1760, 1.1874. The Senkou Span B (1.1581) and Kijun-sen (1.1599) lines can also be sources of signals. Signals can be "rebounds" and "breakthroughs" of these levels and lines. The Stop Loss level is recommended to be set to breakeven when the price passes in the right direction by 20 points. Ichimoku indicator lines can move during the day, which should be taken into account when determining trading signals. The chart also contains support and resistance levels that can be used to take profits on trades. There will finally be a slight lull in the UK on Thursday. Meanwhile, there are three minor reports in America, the reaction to each of which can be 20-30 points, hardly more. Thus, today the pound/dollar pair can continue to trade quite calmly.
Support and Resistance Levels are the levels that serve as targets when buying or selling the pair. You can place Take Profit near these levels.
Kijun-sen and Senkou Span B lines are lines of the Ichimoku indicator transferred to the hourly timeframe from the 4-hour one.
Support and resistance areas are areas from which the price has repeatedly rebounded off.
Yellow lines are trend lines, trend channels and any other technical patterns.
Indicator 1 on the COT charts is the size of the net position of each category of traders.
Indicator 2 on the COT charts is the size of the net position for the non-commercial group.
InstaForex analytical reviews will make you fully aware of market trends! Being an InstaForex client, you are provided with a large number of free services for efficient trading.


