 Stay
Stay 
Trading Conditions
Products
Tools


The EUR/USD pair continued to trade in a flat on Tuesday, which began last week. At this time, the pair remains between the levels of 0.9945 and 1.0072, but if desired, the horizontal channel can be extended to the boundaries of 0.9877 and 1.0072. There is a minimal upward trend, but it certainly cannot be called a "trend". Thus, there is nothing left but to wait for the results of the Federal Reserve meeting, which, by and large, are already known to traders. It's no secret that with a probability of 80% the rate will rise today by 0.75%. The remaining 20% is given to the option with an increase of 1.00%. One way or another, we believe that such a decision should provoke a new growth of the dollar. However, there will also be a speech by Federal Reserve Chairman Jerome Powell, and the reaction of the market is absolutely impossible to predict. Therefore, we advise you to prepare for any movement and for the "swing". As before, the market's reaction to this event may persist for a day, so even this morning it will not be possible to say for sure that the market has fully worked out the FOMC meeting.
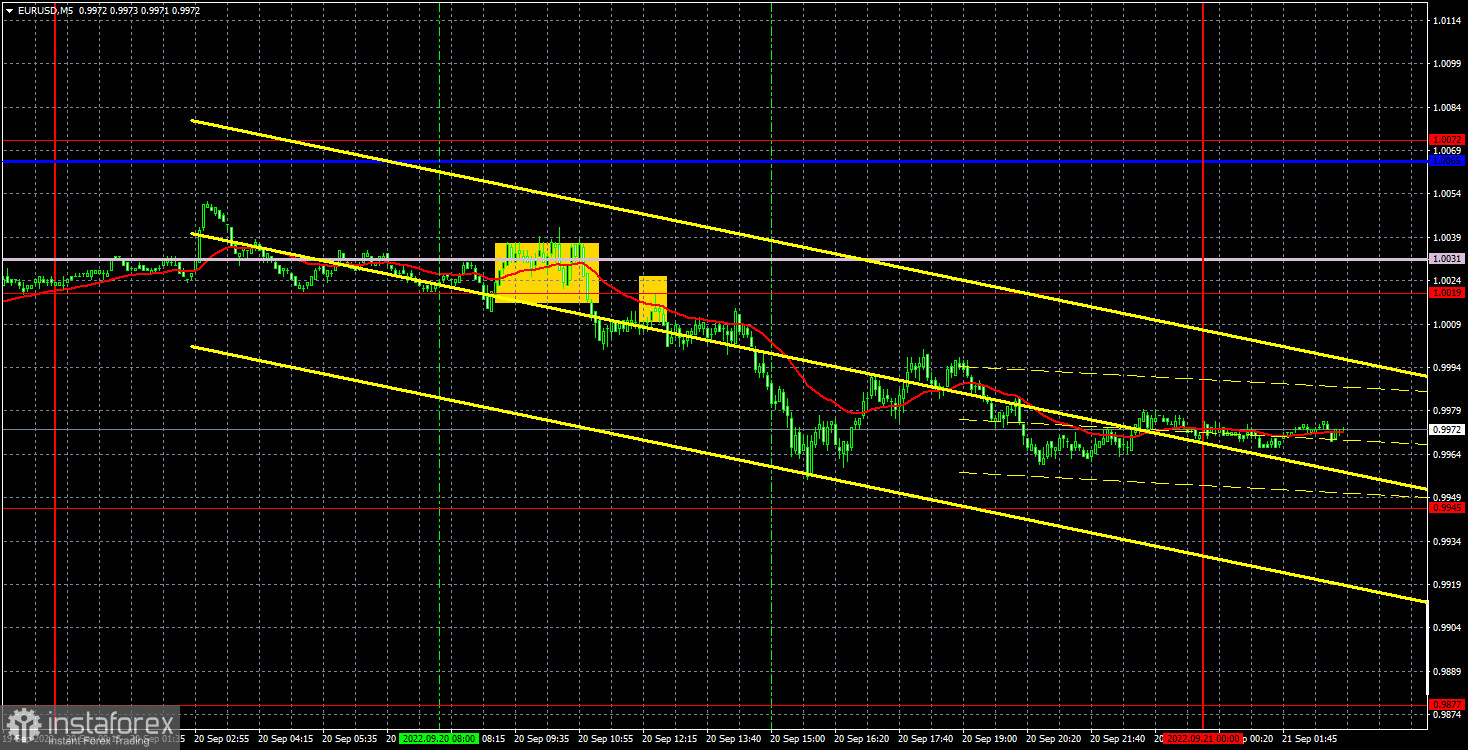
In regards to trading signals, everything was quite simple, which is good news. The price bounced twice from the 1.0019-1.0031 area, so traders had to open one short position (signals duplicated each other). Subsequently, the price went down about 55 points (so the signal cannot be considered false), but failed to work out the nearest target at 0.9945. Therefore, the position had to be closed manually. One could manage to earn about 30-35 points.
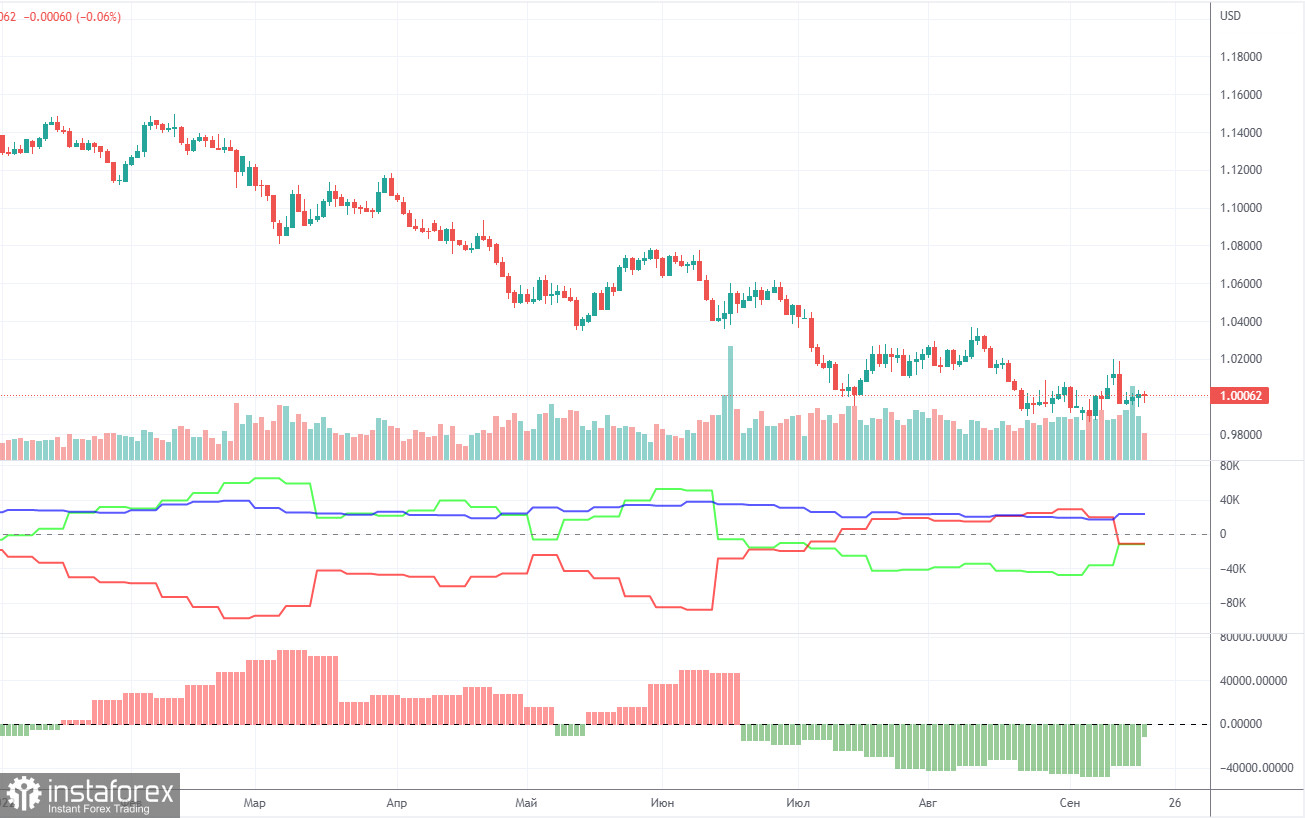
The Commitment of Traders (COT) reports on the euro in the last few months clearly reflect what is happening in the euro/dollar pair. For half of 2022, they showed a blatant bullish mood of commercial players, but at the same time, the euro fell steadily at the same time. At this time, the situation is different, but it is NOT in favor of the euro. If earlier the mood was bullish, and the euro was falling, now the mood is bearish and... the euro is also falling. Therefore, for the time being, we do not see any grounds for the euro's growth, because the vast majority of factors remain against it. During the reporting week, the number of long positions for the non-commercial group increased by 2,500, while the number of shorts decreased by 22,000. Accordingly, the net position grew by about 24,500 contracts. This is quite a lot and we can talk about a significant weakening of the bearish mood. However, so far this fact does not give any dividends to the euro, which still remains "at the bottom". The only thing is that in recent weeks it has done without another collapse, unlike the pound. At this time, commercial traders still do not believe in the euro. The number of longs is lower than the number of shorts for non-commercial traders by 12,000. This difference is no longer too large, so one could expect the start of a new upward trend, but what if the demand for the US dollar remains so high that even the growth in demand for the euro does not save the situation for the euro/dollar currency pair?
Overview of the EUR/USD pair. September 21. Is the Fed stalling on slowing inflation?
Overview of the GBP/USD pair. September 21. The British pound is correcting and does not pay attention to the hawkish mood of the Bank of England.
Forecast and trading signals for GBP/USD on September 21. Detailed analysis of the movement of the pair and trading transactions.
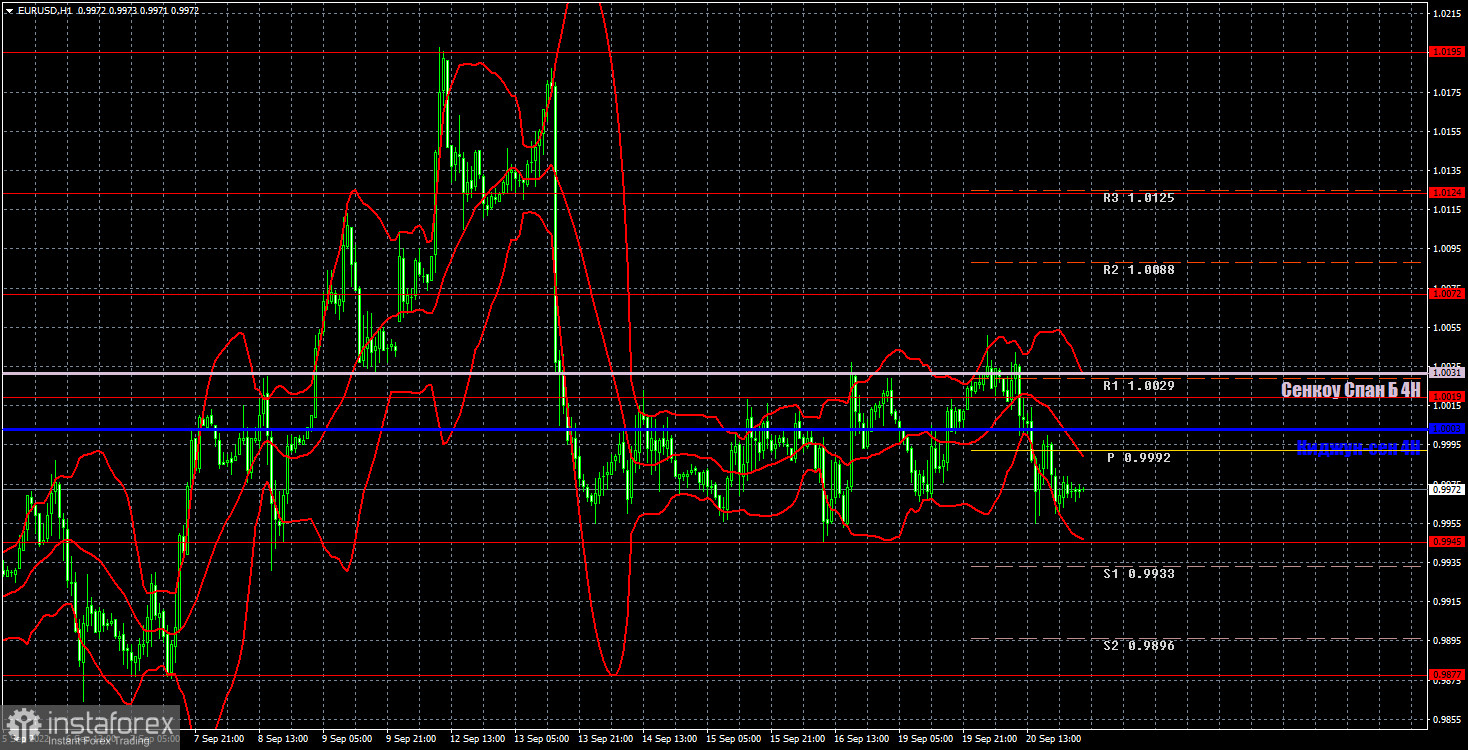
The outlook for the bears remains very good on the hourly timeframe, despite the flat. They manage to stay near 20-year lows for a long time, not allowing the pair to even correct. Therefore, we expect the continuation of the downward movement. Either today or later. But we certainly do not believe that the global downward trend is over. We highlight the following levels for trading on Wednesday - 0.9877, 0.9945, 1.0019, 1.0072, 1.0124, 1.0195, 1.0269, as well as Senkou Span B (1.0031) and Kijun-sen lines (1.0003). Ichimoku indicator lines can move during the day, which should be taken into account when determining trading signals. There are also secondary support and resistance levels, but no signals are formed near them. Signals can be "rebounds" and "breakthrough" extreme levels and lines. Do not forget about placing a Stop Loss order at breakeven if the price has gone in the right direction for 15 points. This will protect you against possible losses if the signal turns out to be false. There will not be a single interesting event in the European Union, and in the United States, as already mentioned, the results of the Fed meeting will be announced late in the evening, economic forecasts will be published and Powell will hold a press conference. Naturally, these events can have a very strong impact on the movement of the euro/dollar pair.
Support and Resistance Levels are the levels that serve as targets when buying or selling the pair. You can place Take Profit near these levels.
Kijun-sen and Senkou Span B lines are lines of the Ichimoku indicator transferred to the hourly timeframe from the 4-hour one.
Support and resistance areas are areas from which the price has repeatedly rebounded off.
Yellow lines are trend lines, trend channels and any other technical patterns.
Indicator 1 on the COT charts is the size of the net position of each category of traders.
Indicator 2 on the COT charts is the size of the net position for the non-commercial group.
InstaForex analytical reviews will make you fully aware of market trends! Being an InstaForex client, you are provided with a large number of free services for efficient trading.

