 Stay
Stay 
Trading Conditions
Products
Tools


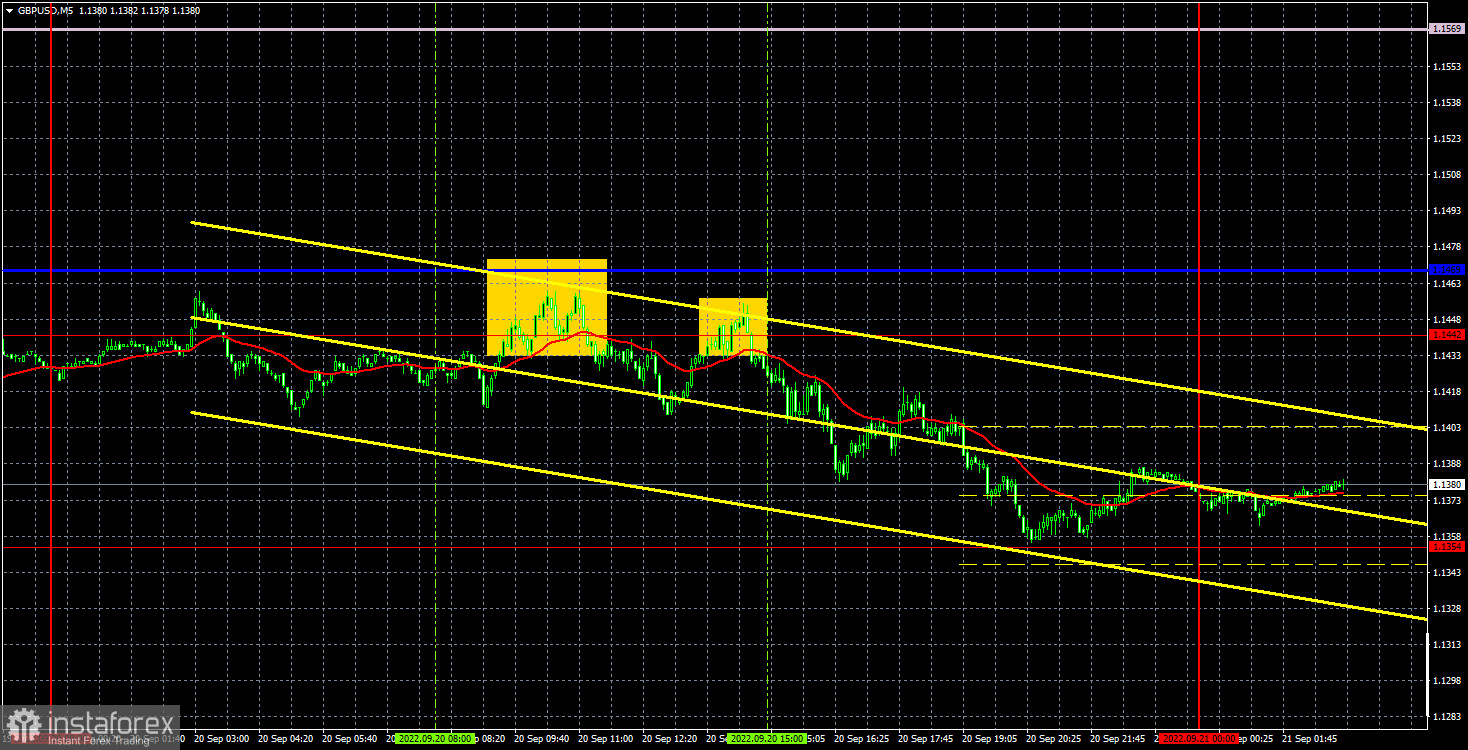
The GBP/USD currency pair was in an open flat for most of the day on Tuesday and only by the end of the day did it decide to resume the downward movement. So it is right at its 37-year lows again for now. In principle, we have repeatedly said that the pair's decline can continue quite freely, and the global downward trend does not look complete. Therefore, the current, new fall of the pound does not surprise us at all. It is surprising that the market does not even want to wait for two meetings of central banks. We once again remind you that the market's reaction to both meetings can be absolutely any, even illogical, even contrary to common sense. Therefore, one should not think that the pound will fall one hundred percent today, when the Federal Reserve raises its rate, and tomorrow, when the Bank of England raises its own, but still remains in the role of catching up. There is no trend line or channel right now, but they are not really needed.
In regards to trading signals for the pound, things were a little more complicated. The first thing to note is the critical line's decline to the level of 1.1469 yesterday. Therefore, the levels 1.1469 and 1.1442 should be considered as an area. It was from this area that the price bounced twice, forming two sell signals. Therefore, two short positions should have been opened. The first one was closed by Stop Loss at breakeven, as the price went down only 20 points. The second - at least 45 points in profit, since after the formation of the corresponding signal, the pound was only falling.
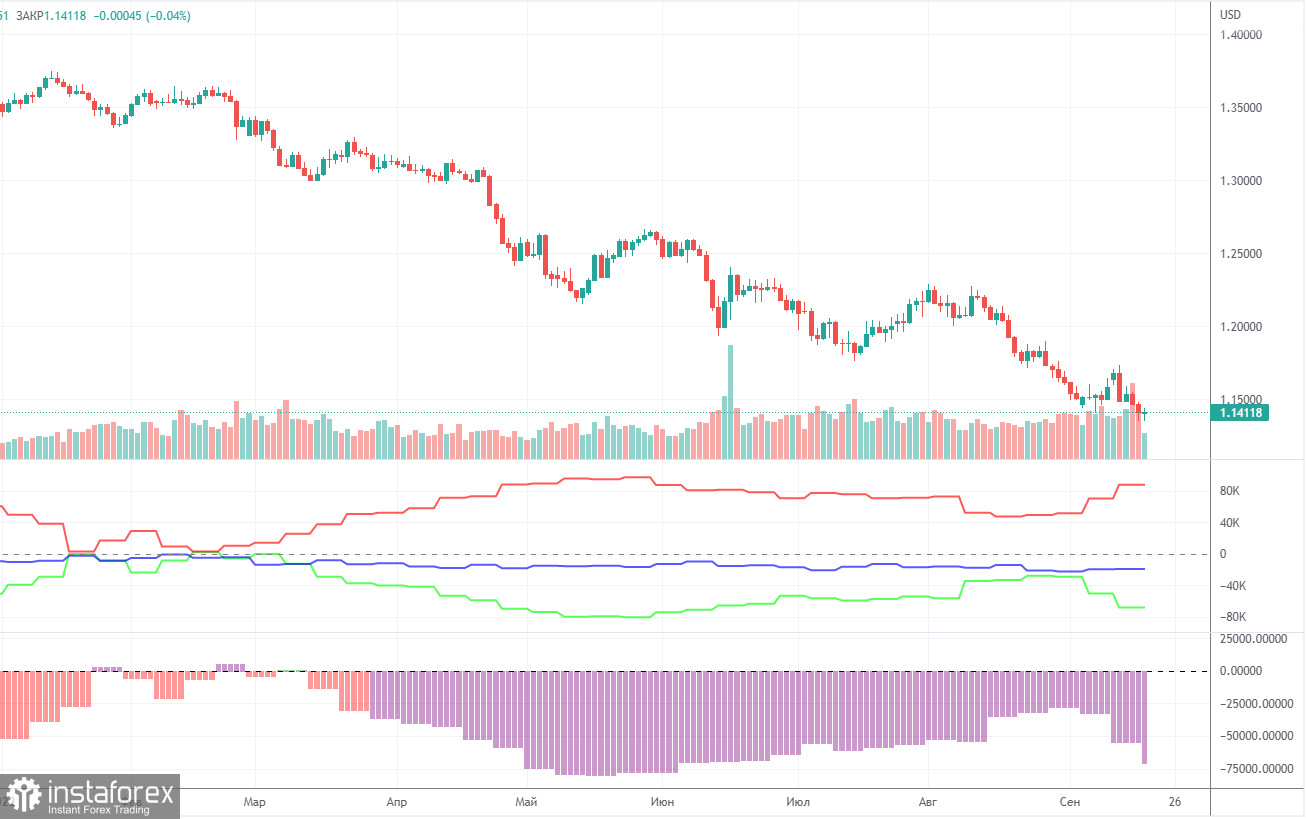
The latest Commitment of Traders (COT) report on the British pound was again very eloquent. During the week, the non-commercial group closed 11,600 long positions and opened 6,000 shorts. Thus, the net position of non-commercial traders decreased by another 17,600, which is a lot for the pound. The net position indicator has been growing for several months, but the mood of the big players still remains "pronounced bearish", which is clearly seen in the second indicator in the chart above (purple bars below zero = bearish mood). And now it has begun a new fall, so the British pound still cannot count on a strong growth. How can you count on it if the market sells the pound more than it buys? And now its decline has completely resumed and multi-year lows are updated almost every day, so the bearish mood of major players in the near future can only intensify. The non-commercial group now has a total of 109,000 shorts and 41,000 longs open. The difference is again almost threefold. The net position will have to show growth for a long time to at least equalize these figures. Moreover, one should not forget about the high demand for the US dollar, which also plays a role in the fall of the pound/dollar pair.
Overview of the EUR/USD pair. September 21. Is the Fed stalling on slowing inflation?
Overview of the GBP/USD pair. September 21. The British pound is correcting and does not pay attention to the hawkish mood of the Bank of England.
Forecast and trading signals for EUR/USD on September 21. Detailed analysis of the movement of the pair and trading transactions.
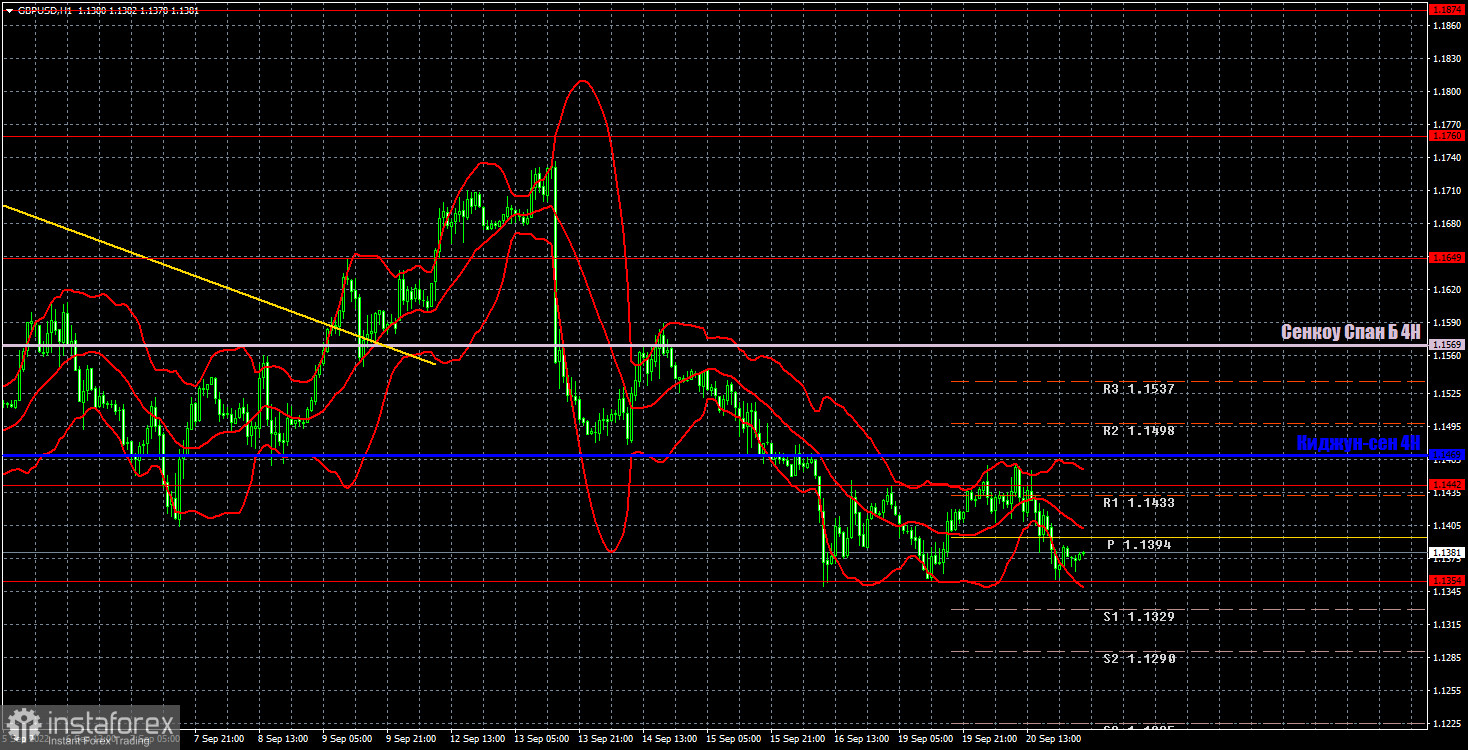
The pound/dollar pair only spent a couple of days in a formal flat on the hourly timeframe. Now it can resume the fall, without even waiting for the meetings of the BoE and the Fed. Overcoming the level of 1.1354 will open the way further down for the pair, but there are no targets there anymore, since the pair has not been so low for 37 years. However, we believe that the pound will continue to fall in the medium term. We highlight the following important levels on September 21: 1.1354, 1.1442, 1.1649, 1.1760, 1.1874. Senkou Span B (1.1569) and Kijun-sen (1.1469) lines can also be sources of signals. Signals can be "rebounds" and "breakthroughs" of these levels and lines. The Stop Loss level is recommended to be set to breakeven when the price passes in the right direction by 20 points. Ichimoku indicator lines can move during the day, which should be taken into account when determining trading signals. The chart also contains support and resistance levels that can be used to take profits on trades. There are no major events or reports scheduled for Wednesday in the UK, and neither in the US during the day. The results of the Fed meeting will be announced only in the evening, but by that time traders will already have to close all transactions and leave the market. We do not recommend trading on strong events and at night. Nevertheless, if at the time of summing up any position is still open, then you can set Stop Loss to breakeven and leave it open.
Support and Resistance Levels are the levels that serve as targets when buying or selling the pair. You can place Take Profit near these levels.
Kijun-sen and Senkou Span B lines are lines of the Ichimoku indicator transferred to the hourly timeframe from the 4-hour one.
Support and resistance areas are areas from which the price has repeatedly rebounded off.
Yellow lines are trend lines, trend channels and any other technical patterns.
Indicator 1 on the COT charts is the size of the net position of each category of traders.
Indicator 2 on the COT charts is the size of the net position for the non-commercial group.
InstaForex analytical reviews will make you fully aware of market trends! Being an InstaForex client, you are provided with a large number of free services for efficient trading.


