 Stay
Stay 
Trading Conditions
Products
Tools


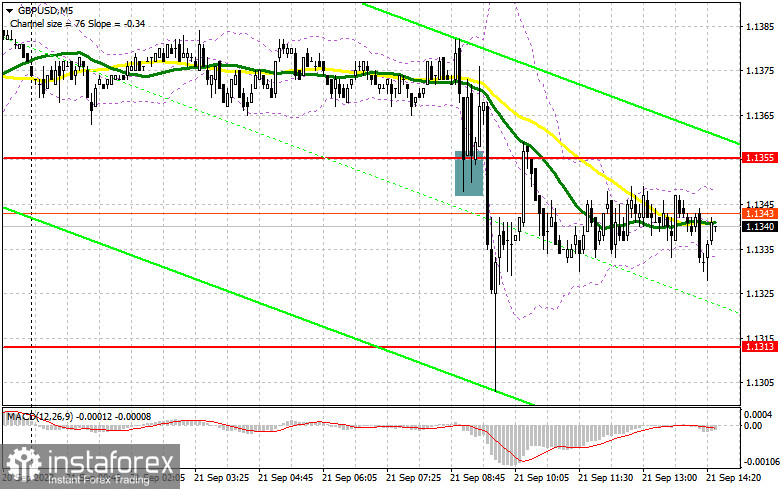
In my previous forecast, I drew your attention to the level of 1.1355 and recommended entering the market from it. Let's have a look at the 5-minute chart and analyze the situation there. The false breakout at 1.1355 gave a good buy signal, as I thought, but it did not push the price considerably higher. After the 20-pips move, the demand for the trading instrument slowed down sharply, which led to a big sell-off at the next support of 1.1313. It was impossible to get a buy signal there because the rebound from this level was quite strong and there was no place to put a Stop Loss order.
Long positions on GBP/USD:
The pair's next move depends on the Fed meeting. The British pound has already reached 1.1300 and a new yearly low. Tomorrow's interest rate decision of the Bank of England plays on the side of bulls. If they manage to defend 1.1318, they may get a pretty good chance to start an upward correction by the end of the week. If the pair remains under pressure and we see strong statistics on the US real estate market, bulls will surely try to move the pair up near 1.1318. It would be better to open long positions from there only after a false breakout like the one I demonstrated above. After that, it will be possible to expect a correction and a rise above the level of 1.1366, which was formed in the first half of the day. A breakthrough and a reverse top/bottom test, against the background of the dovish comments of the Fed, will help to strengthen bulls' confidence, opening the way to 1.1405. The next target is at 1.1451, where traders may take profits. If the GBP/USD pair declines and we see weak activity from buyers at 1.1318, the situation will only get worse, as Stop Loss orders are likely to be triggered and the pound may plunge into the abyss near the yearly lows. If the price drops below 1.1318, it may reach 1.1264. You may open long positions after a false breakout is formed there. Longs are possible on the rebound from 1.1210 or lower from 1.1174, allowing an intraday correction of 30-35 pips.
Short positions on GBP/USD:
The fall of the pound will depend on the Fed meeting. For this reason, before the publication of the reports, I do not expect a strong movement of pair down. The best way is to act on the rise from the resistance of 1.1366, which was formed in the first half of the day. A false breakout at this level may bring the pair down to the intermediate support of 1.1318. A breakthrough and a reverse bottom/top test of that level may give an excellent sell signal with the target at the new yearly low at 1.1264, where traders may generate profits. The next target is located in the area of 1.1207. If the GBP/USD pair rises and we see a lack of activity from bears at 1.1366, bulls may have a chance for a slight uptrend before the Fed meeting. In such a case, it is better to postpone selling the pound. Only a false breakout near 1.1405, where the moving averages pass, may form a sell signal. You may sell the GBP/USD pair on a rebound from 1.1451 or higher from 1.1495, allowing a downward intraday correction of 30-35 pips.
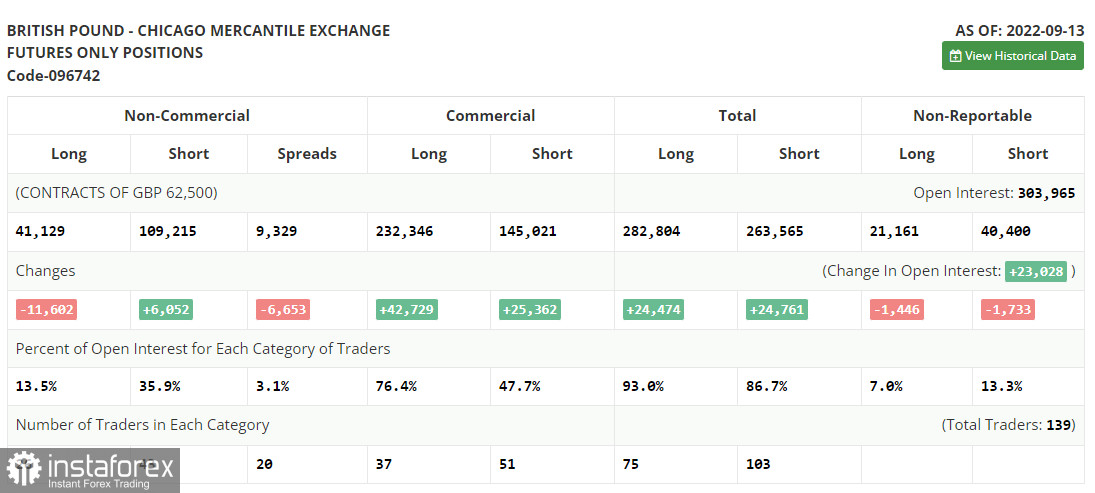
The COT report for September 13 logged an increase in short positions and a reduction in long ones. This confirms the fact that the British pound is maintaining a downtrend, which is not as easy to reverse as it might seem. This week, besides the meeting of the Fed, the Bank of England committee will meet and decide on raising interest rates, which will have a negative impact on the economy, gradually sliding into recession as evidenced by the latest macroeconomic statistics. The recent speech of Bank of England Governor Andrew Bailey confirms the aggressiveness of the committee's intentions. On the one hand, higher interest rates should support the pound but on the other hand, with the sharp slowdown of the economy and the living standards crisis in the UK, such measures make people get rid of the British pound, betting on the US dollar as a safe-haven asset. High rates in the US are also attracting investors, which increases demand for the US dollar. The latest COT report showed that long non-commercials fell by 11,602 to 41,129, while short non-commercials rose by 6,052 to 109,215, dropping the negative non-commercial net position to -68,086 against -50,423. The weekly closing price fell to 1.1504 against 1.1526.
Indicator signals:
Moving averages
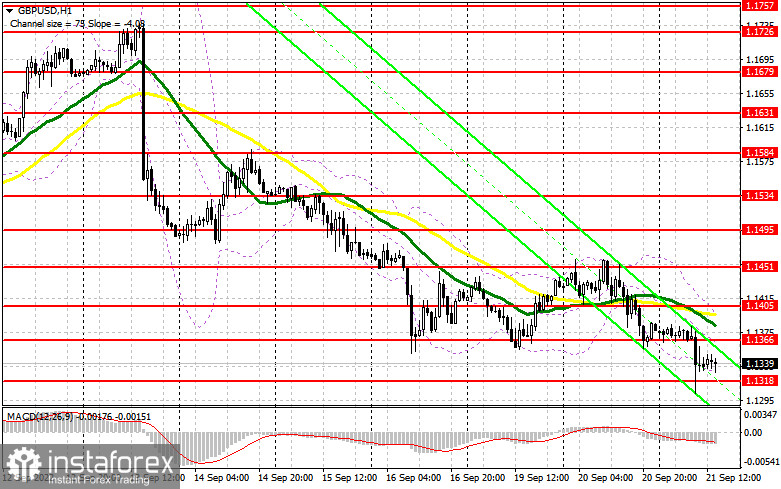
The pair is trading below the 30- and 50-day moving averages, indicating a further decline in the pair.
Note: The period and prices of moving averages are considered by the author on hourly chart H1 and differ from the common definition of classic daily moving averages on daily chart D1.
Bollinger Bands
If the pair declines, the lower boundary of the indicator near 1.1337 will act as support. If the pair grows, the upper boundary of the indicator near 1.1405 will act as resistance.
Indicators description
InstaForex analytical reviews will make you fully aware of market trends! Being an InstaForex client, you are provided with a large number of free services for efficient trading.


