 Stay
Stay 
Trading Conditions
Products
Tools


In the morning article, I turned your attention to the levels of 1.1220 and 1.1268 and recommended making decisions with this level in focus. Now, let's look at the 5-minute chart and try to figure out what actually happened. A false breakout of 1.1220 gave an excellent buy signal. The pound/dollar pair rose by more than 40 pips. A consolidation above 1.1268 and a downward test provided an additional entry point into long positions. At the time of writing the article, the pair advanced by more than 80 pips. In the afternoon, the technical outlook changed slightly.
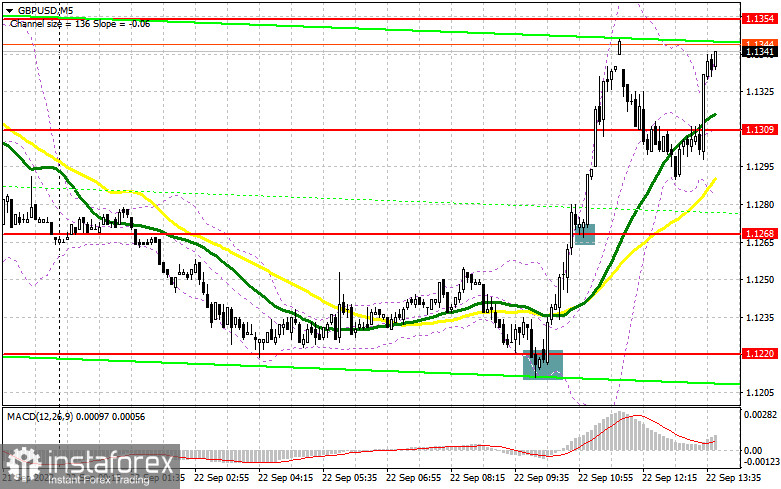
Conditions for opening long positions on GBP/USD
If the Bank of England decides to raise the interest rate more aggressively, it may spook bulls from the market. It may trigger another major sell-off of GBP/USD in the afternoon. For this reason, bulls need to try very hard to protect the new support level of 1.1278 that was formed in the first half of the day. If the pressure on the pound/dollar pair escalates following a rate increase, a buy signal will appear only after a false breakout of 1.1278, similar to the one I have mentioned above. After that, an upward correction to 1.1435 may occur. A breakout and a downward test of this level will take place only amid dovish remarks of BoE policymakers. It may push the pair higher to 1.1405. A more distant target will be a high of 1.1451 where I recommend locking in profits. If GBP/USD falls and bulls show no activity at 1.1278, bears are likely to assert strength. Bulls will have to close their Stop Loss orders. As a result, the pound sterling could decline to the yearly lows of 1.1220. I recommend opening long positions at this level only after a false breakout occurs. You can buy GBP/USD at a bounce from 1.1168 or 1.1113, keeping in mind an upward intraday correction of 30-35 pips.
Conditions for opening short positions on GBP/USD:
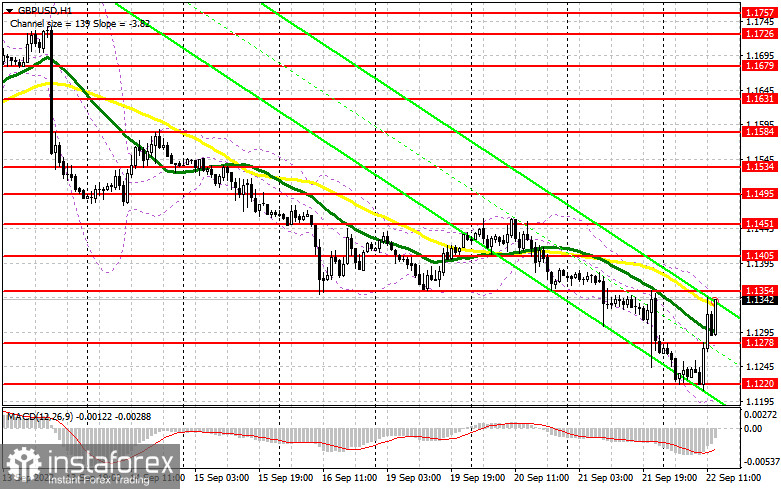
Bears are staying away from the market now, anticipating the BoE's rate decision. Some analysts believe the pound sterling could sink to yearly lows following the meeting. A false breakout of a new resistance level of 1.1354 will surely push GBP/USD to the support level of 1.1278. At this level, bulls may return to the market. Only a breakout and an upward test of this level will generate an excellent sell signal with the prospect of a drop to a new yearly low of 1.1220 where I recommend locking in profits. A more distant target will be the 1.1168 level. The pair may reach this level only in the case of hawkish remarks by the Bank of England on monetary policy. If GBP/USD jumps and bears show no energy at 1.1354, bulls are likely to take an upper hand. As a result, the pair could start an upward correction. If so, I advise opening short positions only if a false breakout of 1.1405 takes place. The moving averages are passing at this level. It will give a sell signal. You can sell GBP/USD at a bounce from 1.1451 or 1.1495, keeping in mind a downward intraday correction of 30-35 pips.
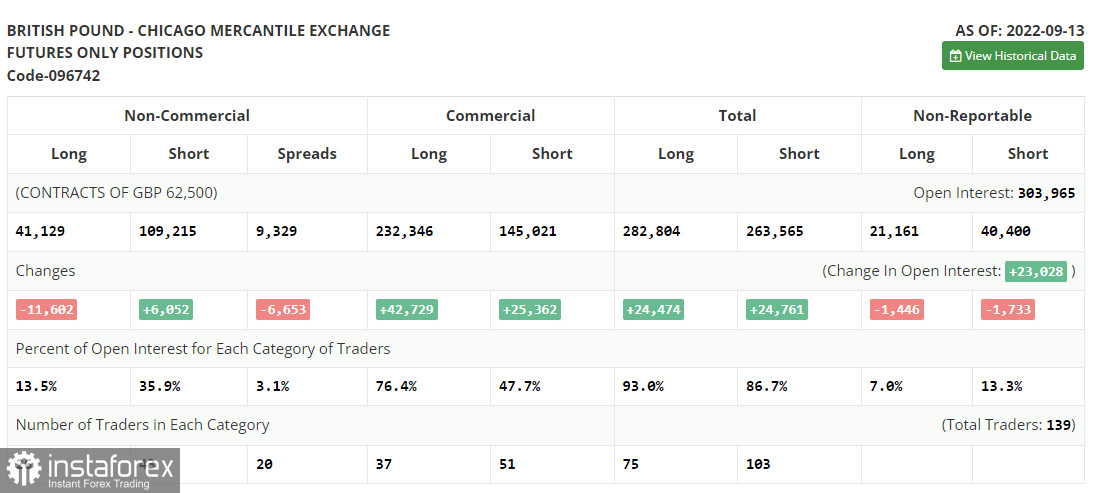
COT report
The COT report for September 13 logged an increase in short positions and a drop in the long ones. This fact once again proves that the pound sterling is following a strong downtrend, which is very difficult to stop. This week, both the Federal Reserve and the Bank of England will hold a meeting. The BoE is expected to raise the benchmark rate. This decision may have a negative effect on the economy, which is slipping toward recession. The worsening of the economic conditions is proved by macroeconomic figures. The recent speech provided by BoE Governor Andrey Bailey is reflecting the regulator's aggressive approach. On the one hand, higher interest rates should boost the British currency. On the other hand, traders are selling off the currency amid the economic slowdown and cost of living crisis. Against the backdrop, demand for the US dollar is mounting. The greenback is also gaining popularity thanks to the key interest rate hike. The recent COT report unveiled that the number of long non-commercial positions declined by 11,602 to 41,129, whereas the number of short non-commercial positions added 6,052 to a total of 109,215. As a result, the negative value of the non-commercial net position jumped to -68,086 from -50,423. The weekly closing price collapsed from 1.1504 to 1.1526.
Signals of technical indicators
Moving averages
EUR/USD is trading below 30- and 50-period moving averages, indicating a further decline in the pound sterling.
Remark. The author is analyzing the period and prices of moving averages on the 1-hour chart. So, it differs from the common definition of classic daily moving averages on the daily chart.
Bollinger Bands
If GBP/USD moves down, the indicator's lower border at 1.1210 will serve as support. If GBP/USD rises, the indicator's upper border at 1.1305 will act as resistance.
Definitions of technical indicators
InstaForex analytical reviews will make you fully aware of market trends! Being an InstaForex client, you are provided with a large number of free services for efficient trading.


