 Stay
Stay 
Trading Conditions
Products
Tools


The Bank of England, as expected, raised the rate by 50 basis points to 2.25%. At the same time, the regulator lowered its inflation forecast. According to their expectations, it may reach 11%, and inflation will peak in October.
The market reaction was zero, because the rate increase by 50 bps has already been taken into account in the quotes. The pound sterling began to weaken.
During the American trading session, weekly data on jobless claims in the United States were published, which recorded a decrease in their total volume. This is positive news for the US labor market.
Statistics details:
The volume of continuing claims for benefits fell from 1.401 million to 1.379 million.
The volume of initial claims for benefits rose from 208,000 to 213,000.
The first is the results of the September Fed meeting, where the regulator clearly indicated that the main goal is to curb inflation, and it is ready to further tighten monetary policy.
The second factor is the Russia-Ukraine situation, where, at the moment, there is a large flow of information that puts speculators into action.

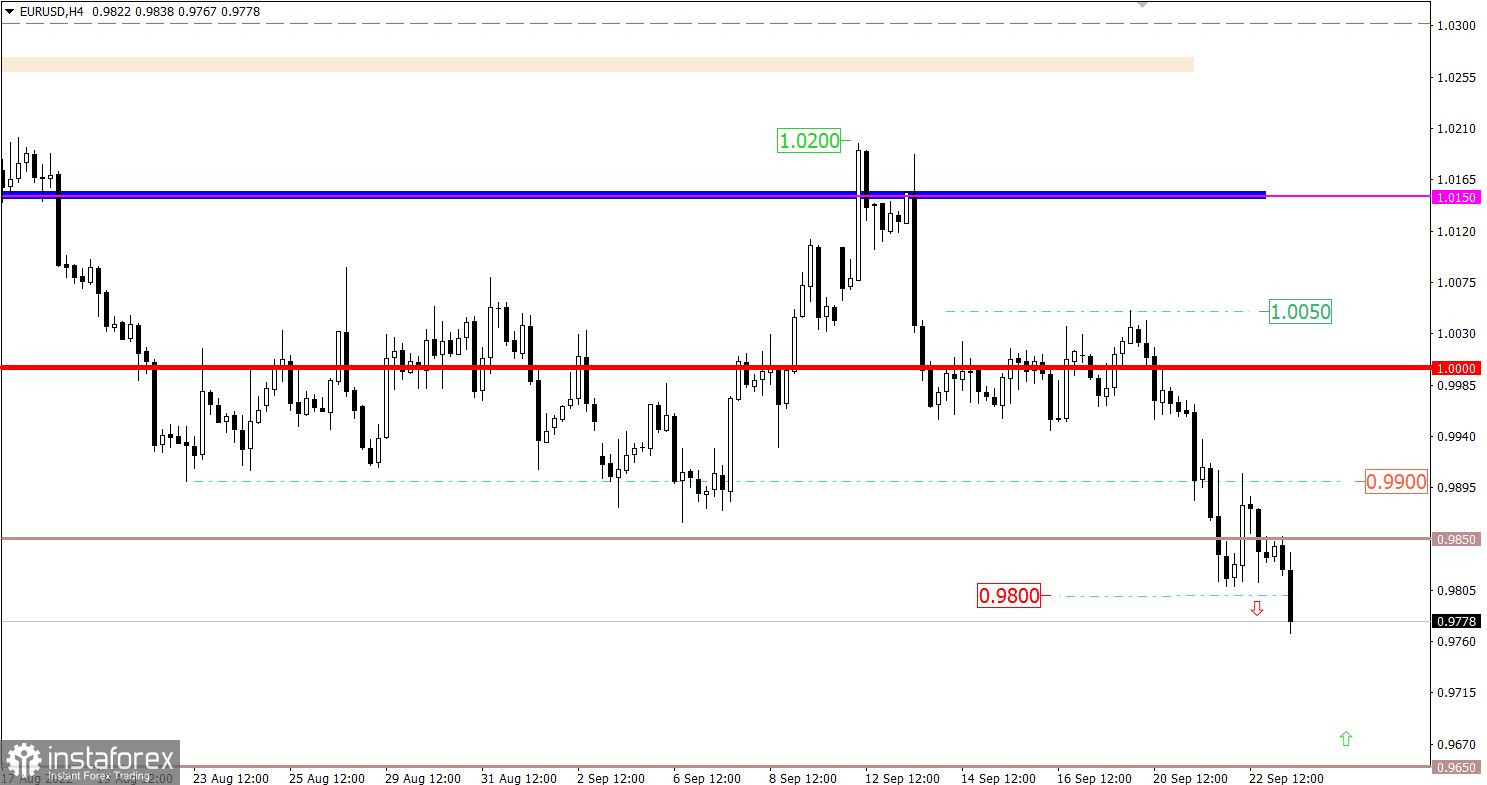
The EURUSD currency pair, in the stage of a pullback from the low of the downward trend, locally returned to the previously passed level of 0.9900, where the price rebounded with a reverse move.
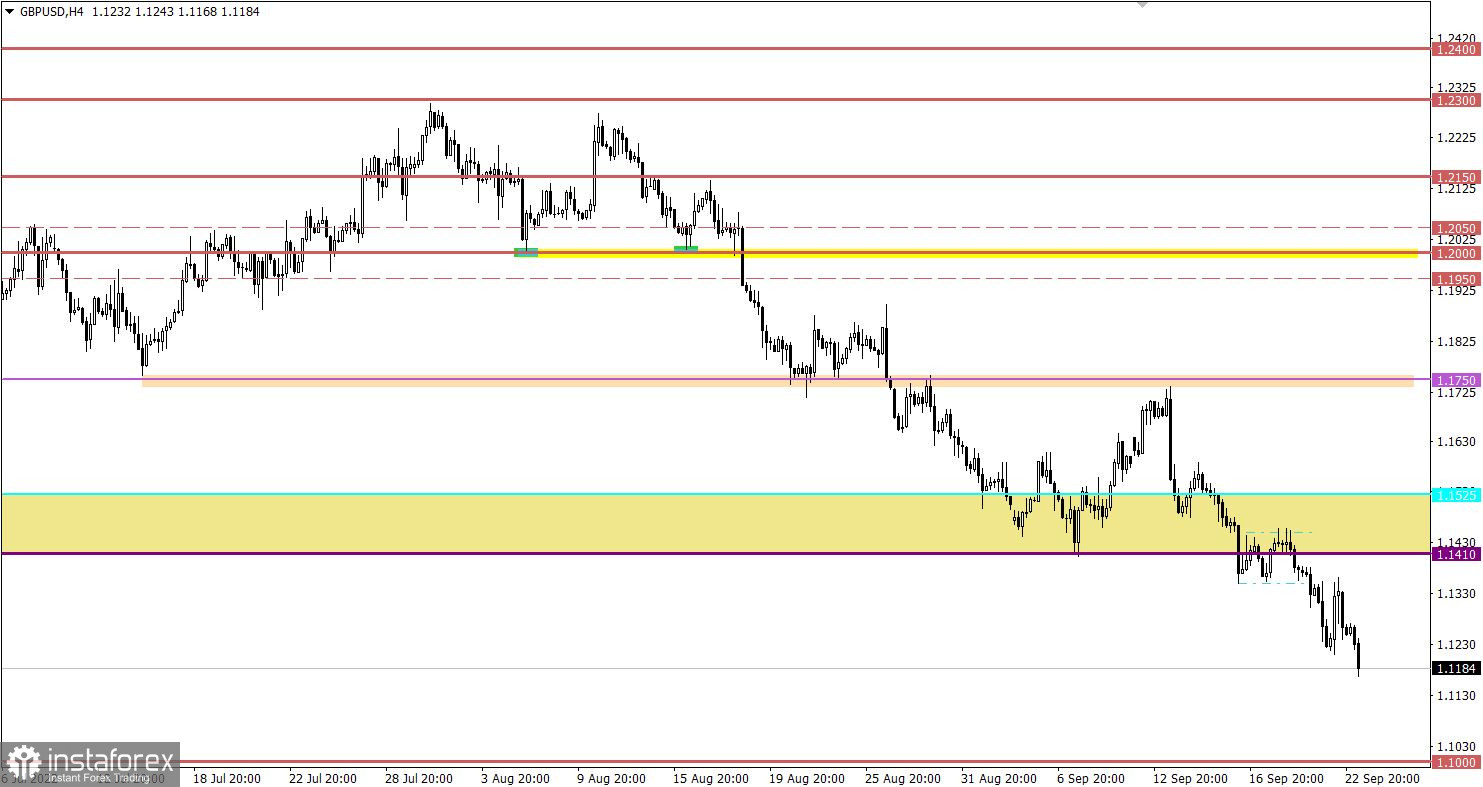
The GBPUSD currency pair, after a short pullback, which was caused by a strong overheating of short positions, again moved to the decline. This movement indicates the prevailing downward sentiment among market participants who are in a stage of inertia.
Today, a preliminary estimate on business activity indices in Europe, the United Kingdom and the United States is expected to be published. Indices, except for the USA, are expected to decrease. Thus, the dollar may well receive support in the market.
Time targeting:
EU business activity indices – 08:00 UTC
UK business activity indices – 08:30 UTC
US business activity indices – 13:45 UTC
With the opening of European platforms, a new round of depreciation of the euro emerged, which led to the price holding below 0.9800. As a result, the speculative-inertial move continues to form, which allows the rate to decline to the subsequent control value of 0.9650, where the lower border of the flat 0.9650/1.0000 passed earlier in history.
It should be noted that the market is already experiencing overheating of euro short positions, which allows for a new technical pullback.
The pound sterling, following the euro, continued to decline, which resulted to the breakdown of the level of 1.1200. A stable hold of the price below this level allows the subsequent weakening of the British currency towards the psychological mark of 1.1000. Also, do not forget about the overheating of short positions and possible technical pullbacks.
A candlestick chart view is graphical rectangles of white and black light, with sticks on top and bottom. When analyzing each candle in detail, you will see its characteristics of a relative period: the opening price, closing price, and maximum and minimum prices.
Horizontal levels are price coordinates, relative to which a stop or a price reversal may occur. These levels are called support and resistance in the market.
Circles and rectangles are highlighted examples where the price of the story unfolded. This color selection indicates horizontal lines that may put pressure on the quote in the future.
The up/down arrows are the reference points of the possible price direction in the future.
InstaForex analytical reviews will make you fully aware of market trends! Being an InstaForex client, you are provided with a large number of free services for efficient trading.

