 Stay
Stay 
Trading Conditions
Products
Tools


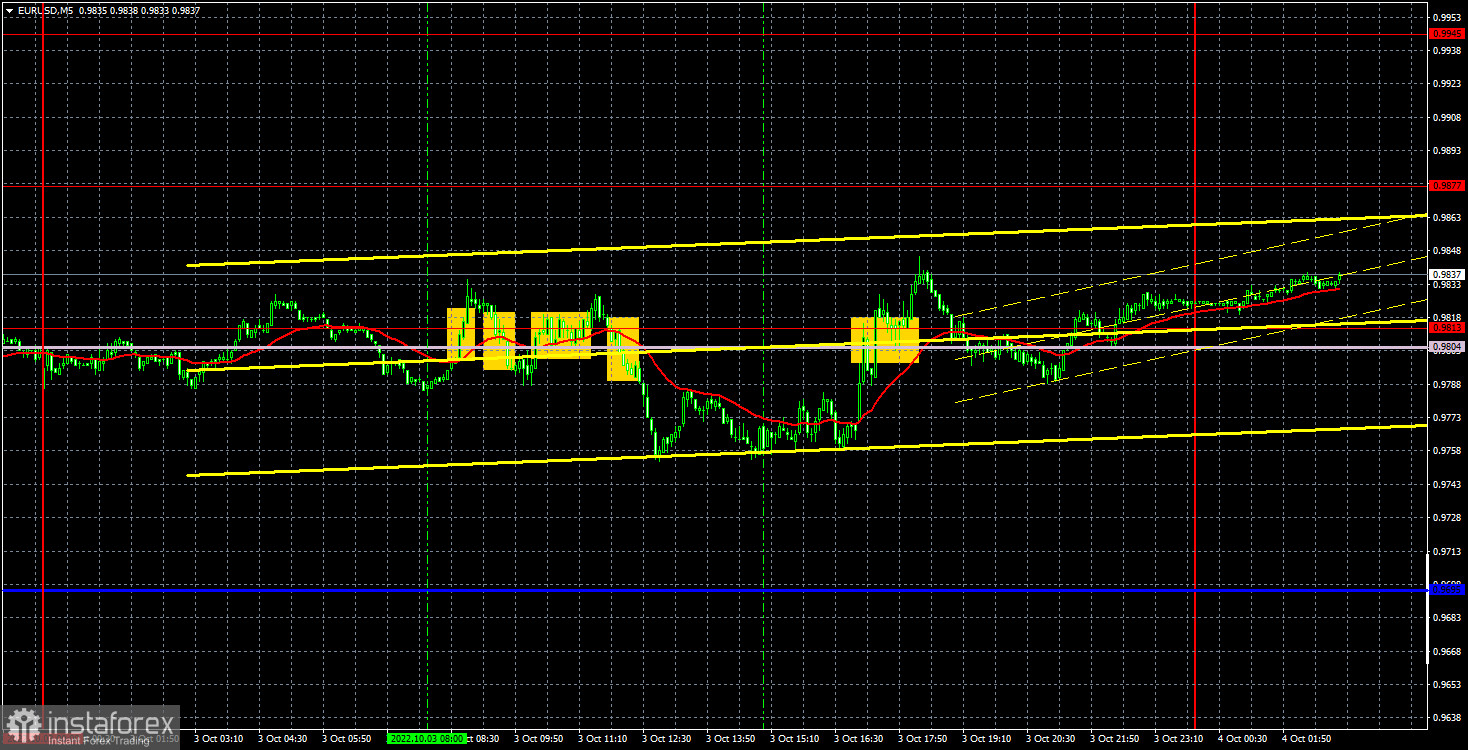
The EUR/USD pair again tried to continue moving up on Monday, although it also managed to show a round of downward movement. Nevertheless, if we consider the last three trading days, it turns out that the pair fell into a horizontal channel. At least, it failed to overcome the level of 0.9844 from several attempts, and there are not so many of these attempts so far to talk about overcoming this level in any case sooner or later. It should be noted that despite the flat, the pair traded surprisingly logically, as a weak EU manufacturing business activity index came out in the morning, and a weak US manufacturing business activity index came out in the afternoon. Accordingly, first the euro fell, then the dollar. Of course, we did not expect that far from the most significant reports would be worked out, but the market was blatantly surprised on Monday. It should also be noted that the price did not clearly settle above the Senkou Span B line. There was no consolidation above the critical line on the 24-hour timeframe. Therefore, unlike the pound, we believe that the euro may resume its decline.
In regards to Monday's trading signals, the situation was sad. There were already signs of a flat at the European trading session, and the price formed four signals near the area of 0.9804-0.9813. Naturally, most of these signals turned out to be false. Therefore, traders could try to work out the first two signals, but most likely received a loss on both transactions. It's okay, bad days are also an integral part of the trading process. All subsequent signals in the same area should not have been worked out.
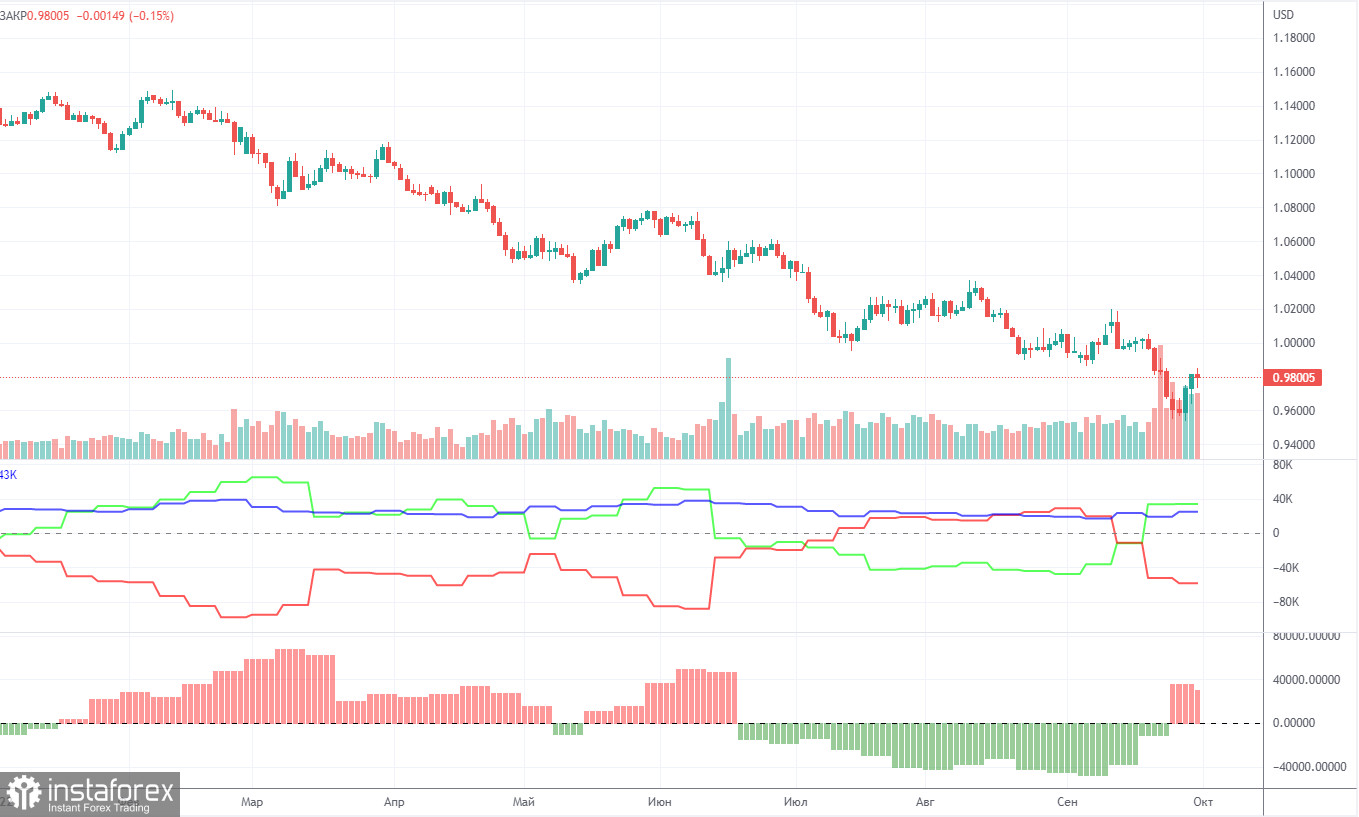
The Commitment of Traders (COT) reports on the euro in 2022 can be entered in the textbook. For half of the year, they showed a blatant bullish mood of commercial players, but at the same time, the euro fell steadily. Then they showed a bearish mood for several months, and the euro also fell steadily. Now the net position of non-commercial traders is bullish again, and the euro continues to fall. This happens, as we have said, because the demand for the US dollar remains high. Therefore, even if the demand for the euro is growing, the high demand for the dollar does not allow the euro itself to rise. During the reporting week, the number of long positions for the non-commercial group increased by 2,000, while the number of shorts decreased by 1,800. Accordingly, the net position grew by about 200 contracts. This is very small and this fact does not matter much, since the euro still remains "at the bottom". At this time, commercial traders still prefer the euro to the dollar. The number of longs is higher than the number of shorts for non-commercial traders by 34,000, but the euro cannot derive any dividends from this. Thus, the net position of the non-commercial group can continue to grow further, this does not change anything. Even if you pay attention to the total number of longs and shorts, their values are approximately the same, but the euro is still falling. Thus, it is necessary to wait for changes in the geopolitical and/or fundamental background.
Overview of the EUR/USD pair. October 4. It is still very difficult to wait for a strong growth from the euro.
Overview of the GBP/USD pair. October 4. The political absurdity in the UK persists.
Forecast and trading signals for GBP/USD on October 4. Detailed analysis of the movement of the pair and trading transactions.
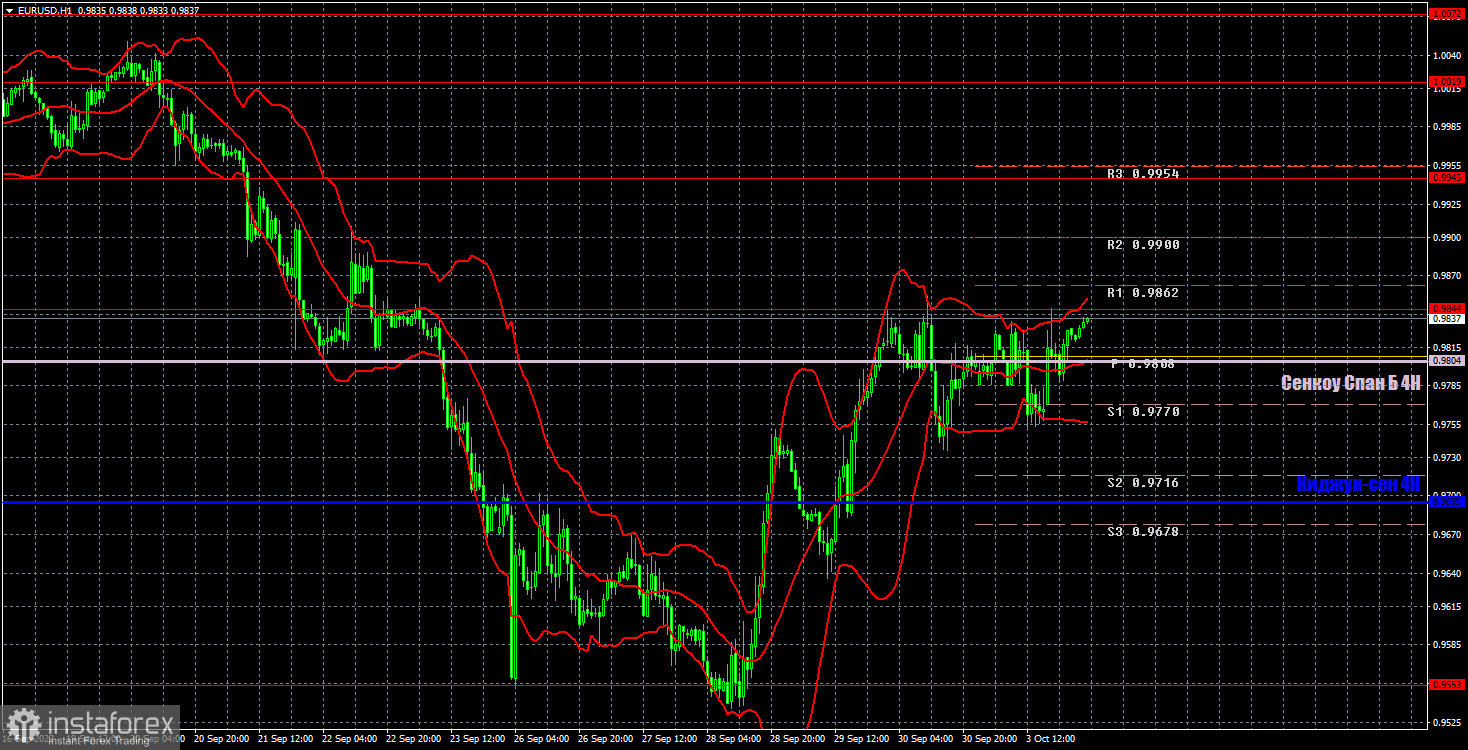
On the hourly timeframe, the trend began to change to an upward one, but the most important and significant levels and lines have not yet been overcome. We believe that until the Senkou Span B line is confidently overcome on the current TF and the Kijun-sen line on the 24-hour TF, it is not necessary to talk about a more powerful growth of the euro currency. The euro, of course, has taken a significant step towards the end of the downtrend, but we recall that so far the upward movement is only a little more than 300 points. On Tuesday, we highlight the following levels for trading - 0.9553, 0.9844, 0.9945, 1.0019, as well as the Senkou Span B (0.9804) and Kijun-sen (0.9695) lines. Ichimoku indicator lines can move during the day, which should be taken into account when determining trading signals. There are also auxiliary support and resistance levels, but no signals are formed near them. Signals can be "rebounds" and "overcoming" extreme levels and lines. Do not forget about placing a Stop Loss order at breakeven if the price has gone in the right direction for 15 points. This will protect against possible losses if the signal turns out to be false. On October 4, ECB President Christine Lagarde will speak in the European Union, whose rhetoric is unlikely to change from three speeches last week. Therefore, we do not expect a strong market reaction. There are no major events or publications scheduled in the US today.
Support and Resistance Levels are the levels that serve as targets when buying or selling the pair. You can place Take Profit near these levels.
Kijun-sen and Senkou Span B lines are lines of the Ichimoku indicator transferred to the hourly timeframe from the 4-hour one.
Support and resistance areas are areas from which the price has repeatedly rebounded off.
Yellow lines are trend lines, trend channels and any other technical patterns.
Indicator 1 on the COT charts is the size of the net position of each category of traders.
Indicator 2 on the COT charts is the size of the net position for the non-commercial group.
InstaForex analytical reviews will make you fully aware of market trends! Being an InstaForex client, you are provided with a large number of free services for efficient trading.

