 Stay
Stay 
Trading Conditions
Products
Tools


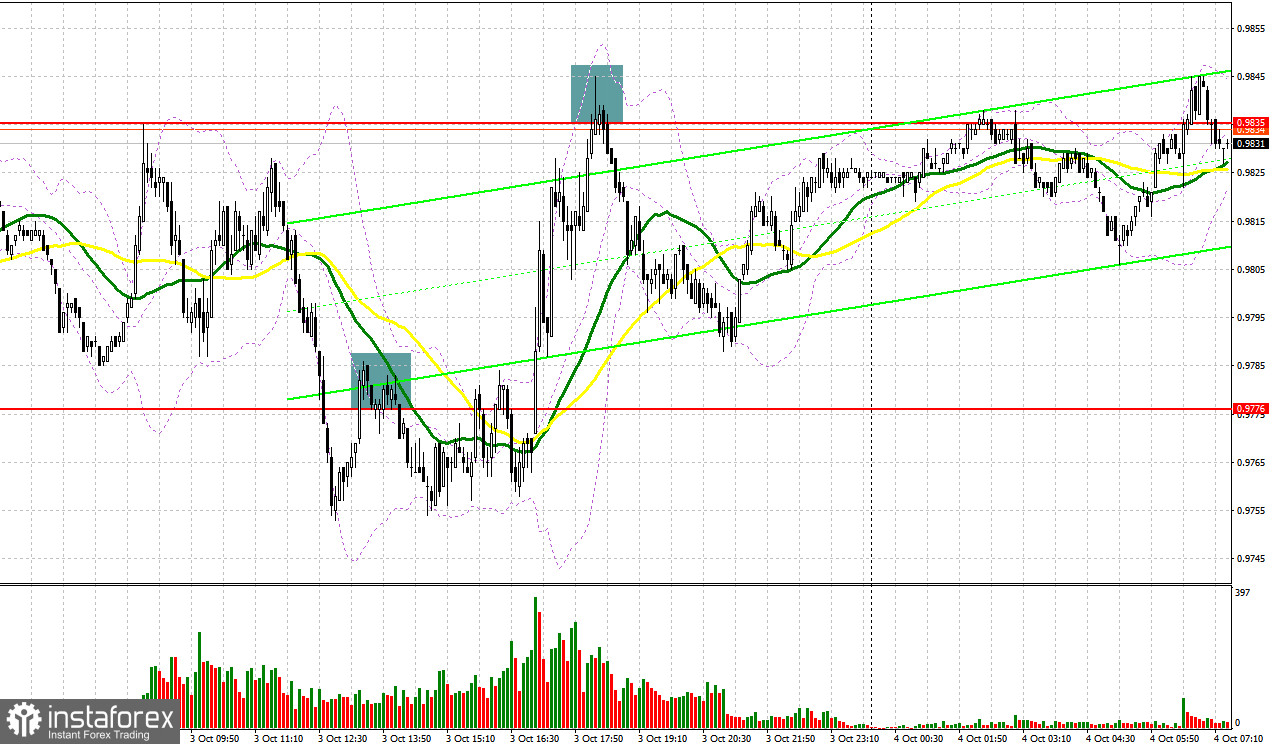
Yesterday, traders received several signals to enter the market. Let us take a look at the 5-minute chart to clear up the market situation. The euro tumbled during the European session. A breakout and an upward test of 0.9776 led to a sell signal. As a result, the pair dropped by 20 pips. Only in the second part of the day, after bulls managed to regain losses, a false breakout of the resistance level of 0.9835 led to another sell signal. This time, the pair lost about 40 pips.
Conditions for opening long positions on EUR/USD:
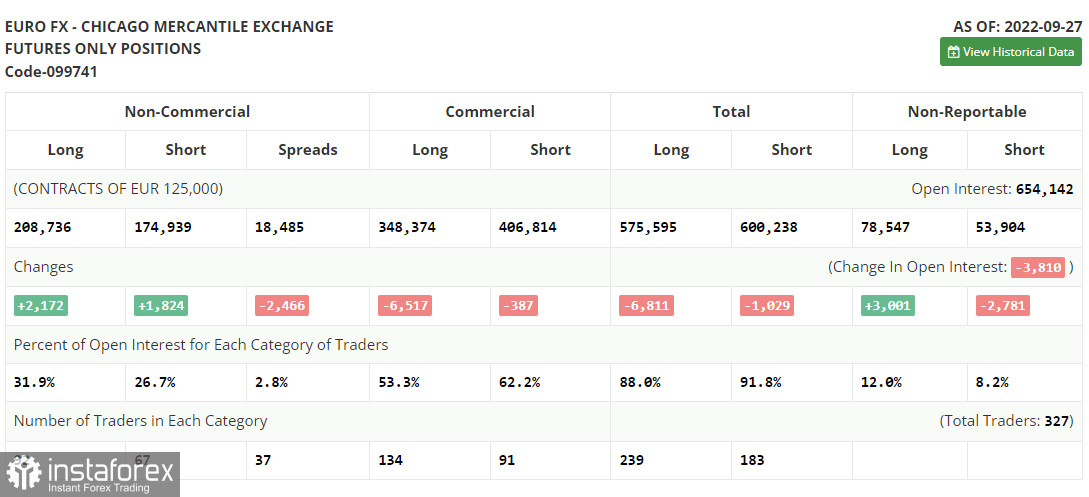
First of all, let us pay attention to the futures market and changes in the COT report. According to the COT report from September 27, the number of both short and long positions increased. After the central banks' meetings, the euro was under considerable pressure caused by comments provided by European and US politicians. However, the currency managed to cope with it and now it has every chance to cover, though for a short period of time. The fact is that inflation in the EU has already exceeded 10.0%. In autumn and winter, the situation will only aggravate. That is why the euro will hardly show considerable growth. The worsening geopolitical situation in the world, which is mainly affecting the eurozone, may cause a considerable slowdown in the local economy, which is likely to slip into recession as early as next spring. Soon, the eurozone will disclose reports on activity in various sectors. A decline may cap the pair's upward potential. The COT report unveiled that the number of long non-commercial positions increased by 2,172 to 208,736, whereas the number of short non-commercial positions surged by 1,824 to 174,939. At the end of the week, the total non-commercial net position remained positive and amounted to 33,797 against 33,449. This indicates that investors are taking advantage of the moment and continue to buy the cheap euro below parity, as well as accumulate long positions, expecting the end of the crisis and the pair's recovery in the long term. The weekly closing price collapsed to 0.9657 from 1.0035.
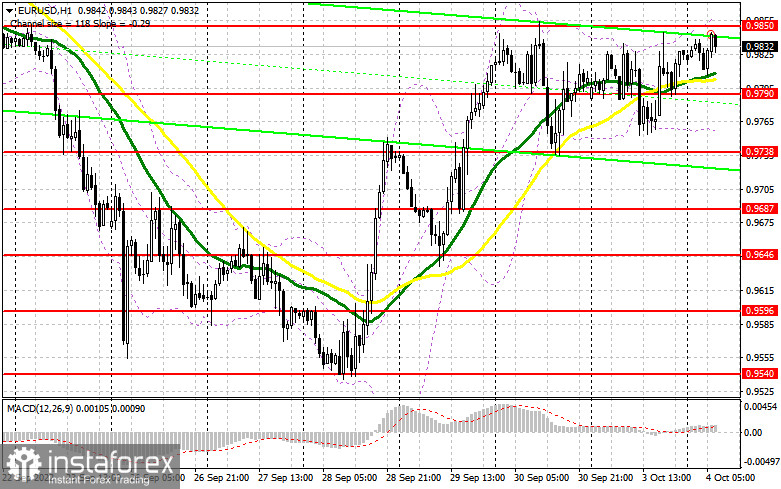
Today, in the first part of the day, the eurozone will not publish any important macroeconomic report. That is why traders will focus on Christine Lagarde's speech. Notably, she will hardly surprise markets. If she talks about the monetary policy after the recent data, which unveiled a record high inflation, bulls may benefit from the situation and seriously affect bears' stop orders. In case of a negative reaction to comments, only a false breakout of the nearest support level of 0.9790 will give a buy signal. In this case, the pair will continue the correction to hit the resistance level of 0.9850, formed last week. Only a breakout and a downward test of this level will allow the pair to climb to a new high of 0.9903. This will provide traders with the hope that the pair is able to return to the parity level. Traders will receive a long signal with the target at 0.9952. The farthest target is located at 0.9996, where it is recommended to lock in profits. If the euro/dollar pair declines and buyers fail to protect 0.9790, bears will regain control over the market. The risk of the bearish trend will become quite high. The last opportunity to go long is to enter the market after a false breakout of the lower limit of the range located at 0.9738. Traders may also open buy orders just after a bounce off the low of 0.9687 or even lower – from 0.9646, expecting an upward correction of 30-35 pips.
Conditions for opening short positions on EUR/USD:
Sellers have faced problems caused by politicians' intention to go on raising interest rates and the 10.0% inflation, which favors them in the mid-term. The fact is that now everyone is interested in the pair's movement within the day. A breakout near the closest resistance level of 0.9850 will give a good sell signal. The price may jump to this level after Christine Lagarde's speech and the recent eurozone PPI data. Notably, in September, the producer price index may surpass 43.1% on a yearly basis. A failure to settle at 0.9850 will cause a drop to 0.9790. A breakout and settlement below this level as well as an upward test will give an additional short signal, which will destroy buyers' stop orders. In this case, the euro may tumble to 0.9738, where it is recommended to lock in profits. The pair may go beyond this level only in the event of strong data from the US. If this happens in the first part of the day, the next support level will be located at 0.9687. If the pair increases during the European session and bears fail to protect 0.9850, the pair may soar. In this case, traders should avoid sell orders until the price touches 0.9903. A false breakout of this level will form a new sell signal. It is also possible to sell the asset just after a rebound from the high of 0.9950 or higher – from 0.9996, expecting a decline of 30-35 pips.
Signals of indicators:
Moving Averages
Trading is performed above the 30- and 50-day moving averages, which points to a further rise in the euro.
Note: The period and prices of moving averages are considered by the author on the one-hour chart, which differs from the general definition of the classic daily moving averages on the daily chart.
Bollinger Bands
A breakout of the upper limit of the indicator located at 1.1370 will cause a new jump.
Description of indicators
InstaForex analytical reviews will make you fully aware of market trends! Being an InstaForex client, you are provided with a large number of free services for efficient trading.

