 Stay
Stay 
Trading Conditions
Products
Tools


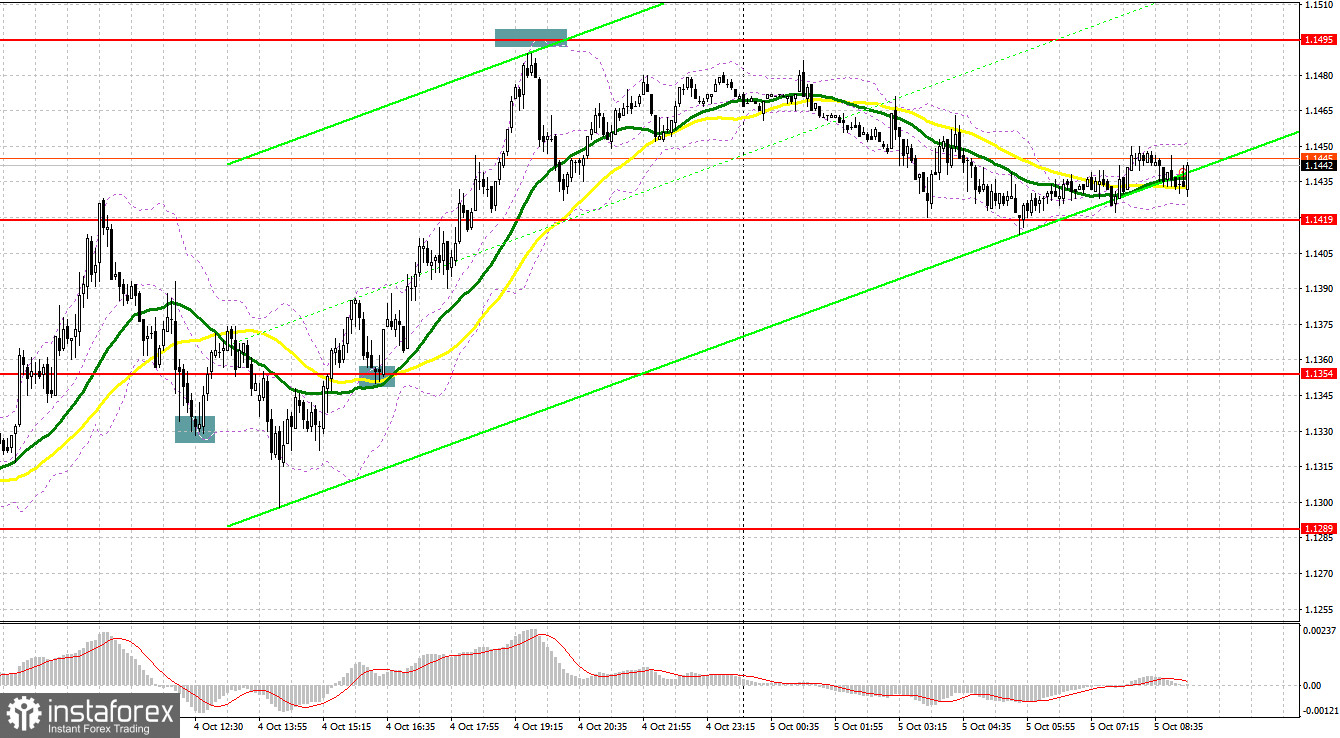
Yesterday, traders received several signals to enter the market. Let us take a look at the 5-minute chart to find out what happened. Earlier, I asked you to pay attention to the level of 1.1338 to decide when to enter the market. After a small correction during the Asian trade, buyers of the pound sterling returned to the market, expecting more significant support from the BoE. The price broke 1.1338 but did not downwardly test it. It lacked just several pips. That is why traders did not open long positions. In the middle of the day, the pair returned to this level and showed a false breakout that led to a buy signal. As a result, the pair recovered by more than 35 pips. In the second part of the day, a breakout and downward test of 1.1354 led to a new buy signal, which allowed the pair to gain over 150 pips. However, the price lacked just several pips to show a false breakout of 1.1495.
Conditions for opening long positions on GBP/USD:
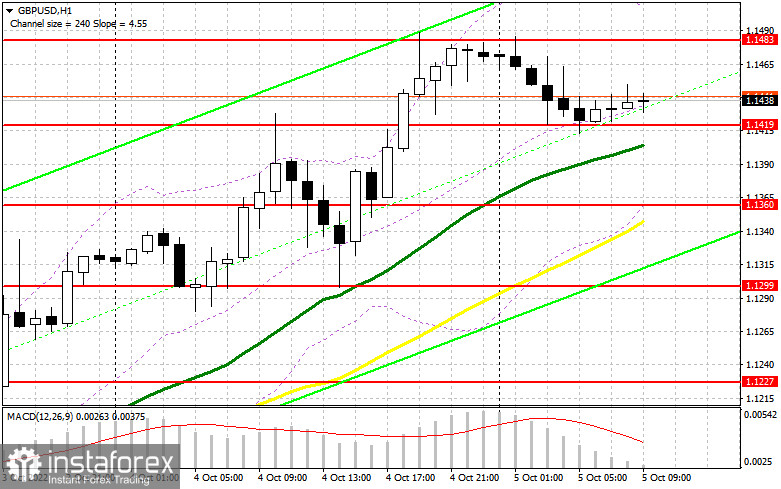
The pound sterling continues rising along with the appetite for risk assets. Today, the UK will disclose a bulk of information, which may cool down buyers since it is unlikely to be positive. Thus, the UK services and composite PMI figures may have a negative influence on the pound sterling. However, they will hardly affect the bullish trend, which began on September 28. If the pair drops, bulls will become active near the intermediate support level of 1.1419, where there are bullish MAs. It will be better to go long after a false breakout of this level, which will give a buy signal with the target at a monthly high of 1.1483. A breakout and downward test of this level may affect speculators' stop orders, thus forming a new buy signal with the target at 1.1534. The farthest target is located at 1.1584, where it is recommended to lock in profits. If the geopolitical situation or the overall situation in the UK worsens, the pound sterling may drop. The fact is that such a rapid increase should end soon, whereas volatility will become moderate. If buyers fail to protect 1.1419, pressure on the pair will return, thus allowing bears to push the price to the low of 1.1360. However, traders could buy there only after a false breakout. Traders may also go long just after a bounce off 1.1299 or lower – from 1.1227, expecting a rise of 30-35 pips.
Conditions for opening short positions on GBP/USD:
Bears are not strong enough to regain control over the market. They will have a chance to do so only after the price hits a new local low above figure 15. Notably, the price is moving towards these levels. That is why it will be wise to open short orders after a false breakout of the resistance level of 1.1483, formed during the Asian trade. If bears fail to take this level under control, the pound/dollar pair will rise even more. However, to become active, bears need weak fundamental data and regain control over the support level of 1.1419. An upward test of this level will give a good entry point with the target at 1.1360, which is close to 1.1299. The farthest target is located at the low of 1.1227, where it is recommended to lock in profits. Notably, the pair will move there only in case of unreasonable steps taken by the UK government. If the pound/dollar pair advances and bears fail to protect 1.1483, the correction may continue to the high of 1.1534. Only a false breakout of this level will give a sell signal. If bears fail to be active, it will be possible to sell the pair just after a rebound from 1.1584, expecting a decline of 30-35 pips.
COT report
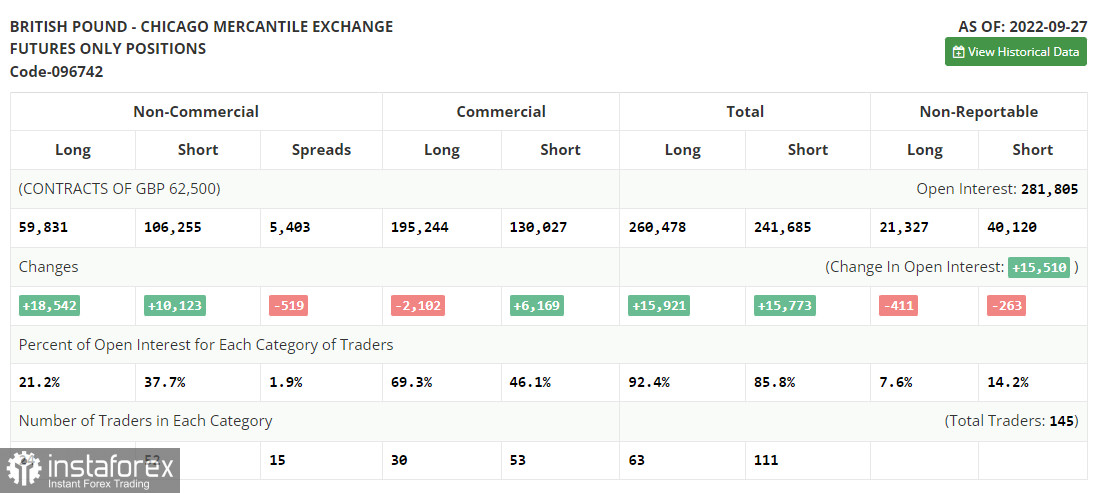
According to the COT report from September 27, the number of both long and short positions surged. Just in two days, the pound sterling lost about 10%. That is why the BoE had to intervene in the market to stabilize the situation. As a result, demand and the number of long positions increased. Notably, long positions increased more than short ones. After the BoE raised the benchmark rate just by 0.5%, the British pound tumbled to the all-time low against the US dollar, lacking just several pips to hit the parity level. However, the regulator's intervention in the bond market stabilized the currency market situation. This allowed bulls to recoup most of their losses. However, it is still unknown how long these actions will support the pound sterling. The fact is that the regulator is planning to raise the benchmark even more. This week, the UK will disclose data on business activity in various sectors. This may seriously affect the pound sterling and cap its upward potential. The recent COT report unveiled that the number of long non-commercial positions increased by 18,831 to 59,831, while the number of short non–commercial positions jumped by 10,123 to 106,255. This led to another small drop in the negative value of the non-commercial net position to the level of -46,424 versus -54,843. The weekly closing price collapsed from 1.0738 to 1.1392.
Signals of indicators:
Moving Averages
Trading is performed above the 30- and 50-day moving averages, which points to a further rise in the pound sterling.
Note: The period and prices of moving averages are considered by the author on the one-hour chart, which differs from the general definition of the classic daily moving averages on the daily chart.
Bollinger Bands
A breakout of the upper limit of the indicator located at 1.1370 will cause a new jump.
Description of indicators
InstaForex analytical reviews will make you fully aware of market trends! Being an InstaForex client, you are provided with a large number of free services for efficient trading.

