 Stay
Stay 
Trading Conditions
Products
Tools


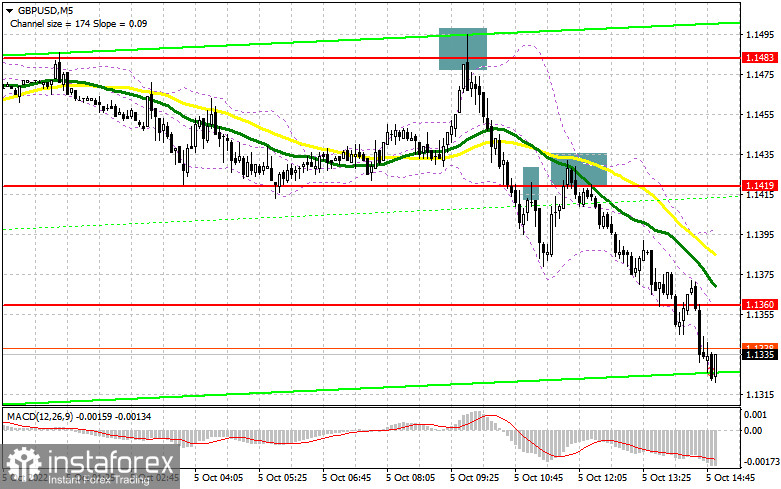
In the morning article, I turned your attention to the 1.1483 and 1.1419 levels and recommended making decisions with these levels in focus. Now, let's look at the 5-miute chart and try to figure out what actually happened. After a slight increase in the morning, the bulls failed to push the pair above 1.1483. A false breakout gave an excellent sell signal. The pair moved down by 70 pips. A breakout and an upward test of 1.1419 generated another entry point into short positions. The quotes declined by 60 pips. In the afternoon, the technical outlook changed.
Conditions for opening long positions on GBP/USD:
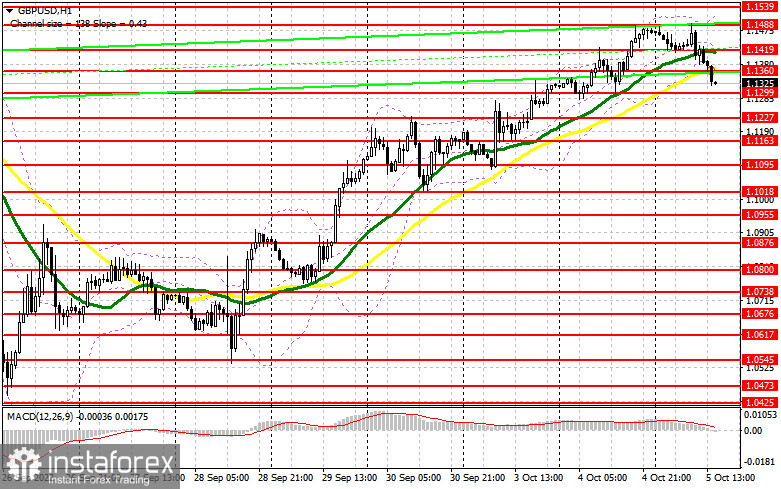
The pound sterling was unable to reach a new monthly high despite positive economic reports that topped expectations. These indicators have only signaled how fragile the economy is. The US is going to release the same data in the afternoon. The figures are projected to be weak. However, traders are looking forward to the ADP Employment Change report, trade balance data, and Raphael Bostic's hawkish speech. The pound sterling may fall following these events. It is recommended to open long positions after a false breakout of the support level of 1.1299. The British currency is now heading for this level. It will give an excellent buy signal with the prospect of a rise to the 1.1360 level. There are also moving averages that are passing in the negative territory. Only after climbing above this range, a further upward correction to 1.1419 may occur. At this level, it will become more difficult for bulls to control the market. A more distant target will be the 1.1488 level which will force sellers to leave the market. I recommend locking in profits there. If the GBP/USD falls following hawkish statements of the Fed official and bulls show no activity at 1.1299, the pressure on the pound sterling will increase. If so, it would be appropriate to cancel long positions until a false breakout of 1.1227. You can buy GBP/USD immediately at a bounce from 1.1163 or 1.1095, keeping in mind an upward intraday correction of 30-35 pips.
Conditions for opening short positions on GBP/USD:
The main task of bears is to protect the nearest resistance level of 1.1360. Only a false breakout of this level will return pressure on the pound sterling. It may also trigger a large downward correction with a breakout of a low of 1.1299. A breakout and an upward test of this level will give a sell signal with a prospect of a fall to 1.1227. However, the target level will be 1.1163, which is the lower border of the upward channel formed on September 28. If GBP/USD rises and bears show no energy at 1.1360 bulls may regain the upper hand. The pair may approach a high of 1.1419. Only a false breakout of this level will generate a sell signal and trigger a downward correction. If bears do not assert, the pair may jump to a high of 1.1488. You can sell GBP/USD immediately at a bounce from this level, keeping in mind an intraday downward correction of 30-35 pips.
COT report
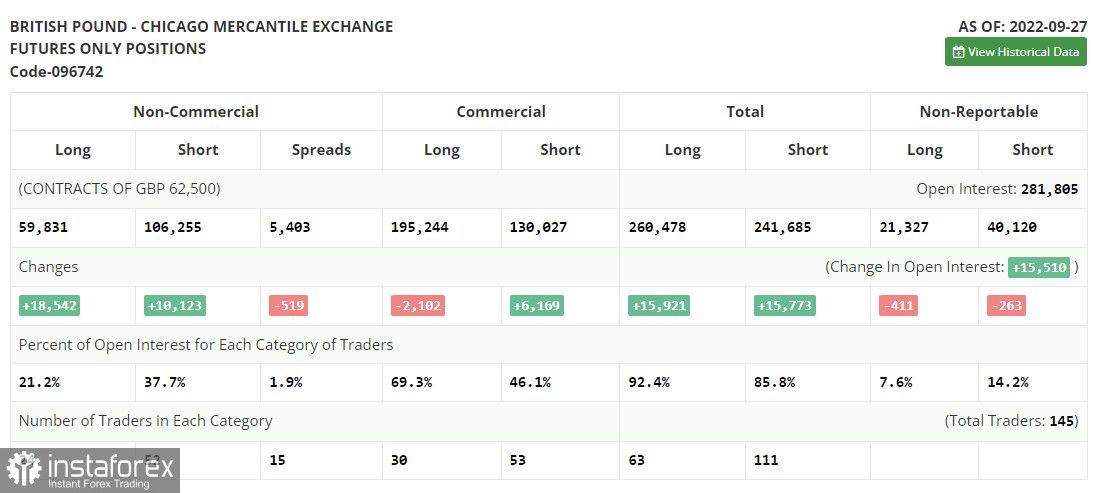
According to the COT report from September 27, the number of both long and short positions surged. Just in two days, the pound sterling lost about 10%. That is why the BoE had to intervene in the market to stabilize the situation. As a result, demand and the number of long positions increased. Notably, long positions increased more than short ones. After the BoE raised the benchmark rate just by 0.5%, the British pound tumbled to the all-time low against the US dollar, lacking just several pips to hit the parity level. However, the regulator's intervention in the bond market stabilized the currency market situation. This allowed bulls to recoup most of their losses. However, it is still unknown how long these actions will support the pound sterling. The fact is that the regulator is planning to raise the benchmark even more. This week, the UK will disclose data on business activity in various sectors. This may seriously affect the pound sterling and cap its upward potential. The recent COT report unveiled that the number of long non-commercial positions increased by 18,831 to 59,831, while the number of short non–commercial positions jumped by 10,123 to 106,255. This led to another small drop in the negative value of the non-commercial net position to the level of -46,424 versus -54,843. The weekly closing price collapsed from 1.0738 to 1.1392.
Signals of technical indicators
Moving averages
GBP/USD is trading below 30- and 50-period moving averages. It means that the bears don't give up attempts to carry on with a downward correction.
Remark. The author is analyzing the period and prices of moving averages on the 1-hour chart. So, it differs from the common definition of classic daily moving averages on the daily chart.
Bollinger Bands
If GBP/USD climbs, the indicator's upper border at 1.1488 will act as resistance.
Definitions of technical indicators
InstaForex analytical reviews will make you fully aware of market trends! Being an InstaForex client, you are provided with a large number of free services for efficient trading.


