 Stay
Stay 
Trading Conditions
Products
Tools


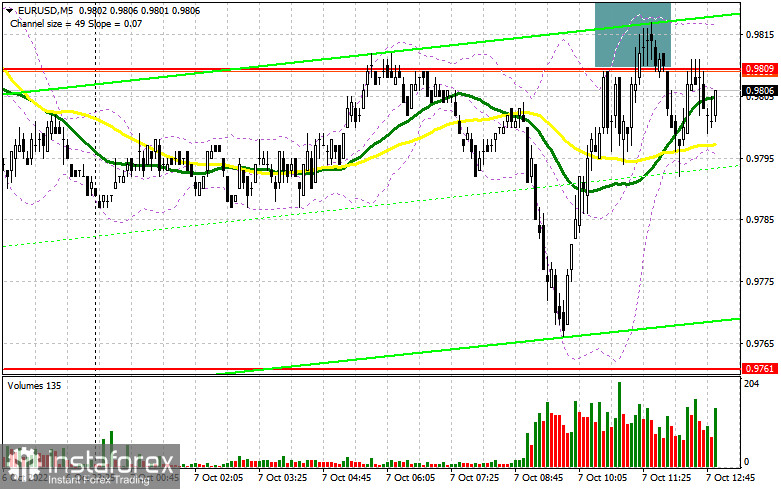
In the morning article, I turned your attention to the 0.9809 level and recommended making decisions with this level in focus. Now, let's look at the 5-minute chart and try to figure out what actually happened. A decline to 0.9761 occurred without an upward test. This is why I did not open long positions at this level. The pair made an attempt to break through 0.9809. It led to a false breakout and a sell signal. The euro dropped by 12 pips and that was the end of it. For the second half of the day, the technical outlook has changed slightly as a surge in volatility is expected.
Conditions for opening long positions on EUR/USD:
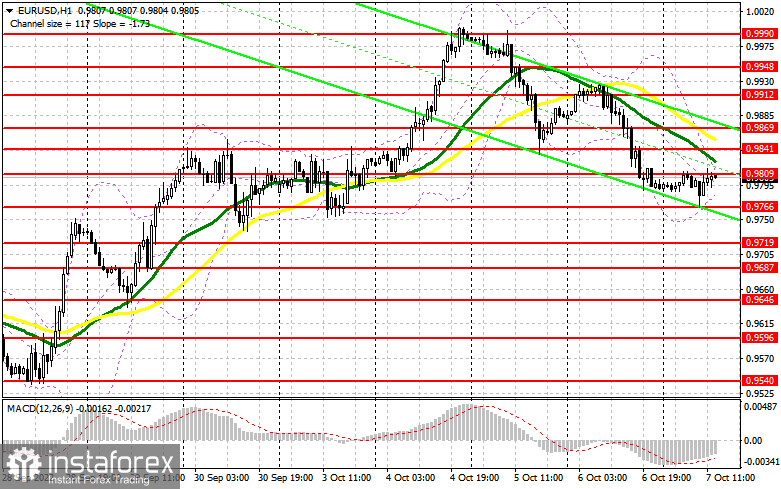
As long as trading is carried out below 0.9809, the bears may initiate a large downward movement. However, the further trajectory of the pair will largely depend on the US Nonfarm Payrolls report on the unemployment rate. A sharp increase above the August reading will help the US dollar resume an upward movement. Besides, it will be a signal to the Fed to continue monetary tightening despite the risk of an economic slowdown. If the NFP indicator drops sharply or turns out to be negative, the euro is sure to rise considerably against the US dollar. It may resume a rally that has been unfolding since September 28. If EUR/USD slides, only a false breakout of 0.9766 will provide a buy signal with the prospect of a rise to the resistance level of 0.9809 where the moving averages are moving in negative territory. Consolidation above this level and a downward test will negate the efforts of the bears to control the market. A buy signal may appear with the price rising to 0.9841. A breakout of this level will open the path to 0.9869. A more distant target will be the 0.9912 level where I recommend locking in profits. If EUR/USD decreases after strong NFP data and Fed policymaker John Williams's speech, a breakout of 0.9766 may push the euro down to the next support level of 0.9719. I recommend opening long positions there only after a false breakout. You can buy EUR/USD immediately at a bounce from a low of 0.9687 or 0.9646, keeping in mind an upward intraday correction of 30-35 pips.
Conditions for opening short positions on EUR/USD:
The bears are aiming at 0.9766, which is the new support level formed in the morning. Nevertheless, the most important task is to protect the nearest resistance level of 0.9809. There have already been several signals at this level this morning. If the NFP report is strong, it could undermine the upward movement of the euro. Hence, it may decrease to 0.9766. A breakout below this level will exert extra pressure on the euro. An upward test will give a sell signal, forcing the bulls to close their Stop Loss orders. The price is likely to tumble to a low of 0.9719. A more distant target will be the support level of 0.9687 where I recommend locking in profits. If EUR/USD rises during the US session and bears show no energy at 0.9809, which is more likely, bills are likely to regain the upper hand. If so, an upward correction to a high of 0.9841 may take place. It is better to sell at this level only after a false breakout. You can sell EUR/USD immediately at a bounce from 0.9869 or 0.9912, keeping in mind a downward intraday correction of 30-35 pips.
COT report
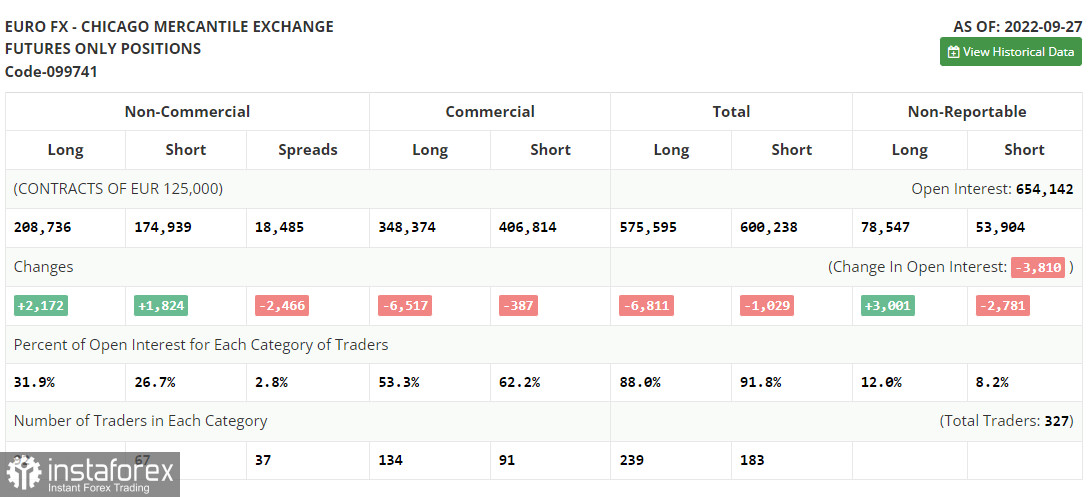
According to the COT report from September 27, the number of both short and long positions increased. After the central banks' meetings, the euro was under considerable pressure caused by the comments provided by European and US politicians. However, the currency managed to cope with it and now it has every chance to cover, though for a short period of time. The fact is that inflation in the EU has already exceeded 10.0%. In autumn and winter, the situation will only aggravate. That is why the euro will hardly show considerable growth. The worsening geopolitical situation in the world, which is mainly affecting the eurozone, may cause a considerable slowdown in the local economy, which is likely to slip into recession as early as next spring. Soon, the eurozone will disclose reports on activity in various sectors. A decline may cap the pair's upward potential. The COT report unveiled that the number of long non-commercial positions increased by 2,172 to 208,736, whereas the number of short non-commercial positions surged by 1,824 to 174,939. At the end of the week, the total non-commercial net position remained positive and amounted to 33,797 against 33,449. This indicates that investors are taking advantage of the moment and continue to buy the cheap euro below parity, as well as accumulate long positions, expecting the end of the crisis and the pair's recovery in the long term. The weekly closing price collapsed to 0.9657 from 1.0035.
Signals of technical indicators
Moving averages
EUR/USD is trading below 30- and 50-period moving averages. It means that the bears don't give up attempts to regain the upper hand.
Remark. The author is analyzing the period and prices of moving averages on the 1-hour chart. So, it differs from the common definition of classic daily moving averages on the daily chart.
Bollinger Bands
If EUR/USD climbs, the indicator's upper border at.9809 will act as resistance.
Definitions of technical indicators
InstaForex analytical reviews will make you fully aware of market trends! Being an InstaForex client, you are provided with a large number of free services for efficient trading.

