 Stay
Stay 
Trading Conditions
Products
Tools


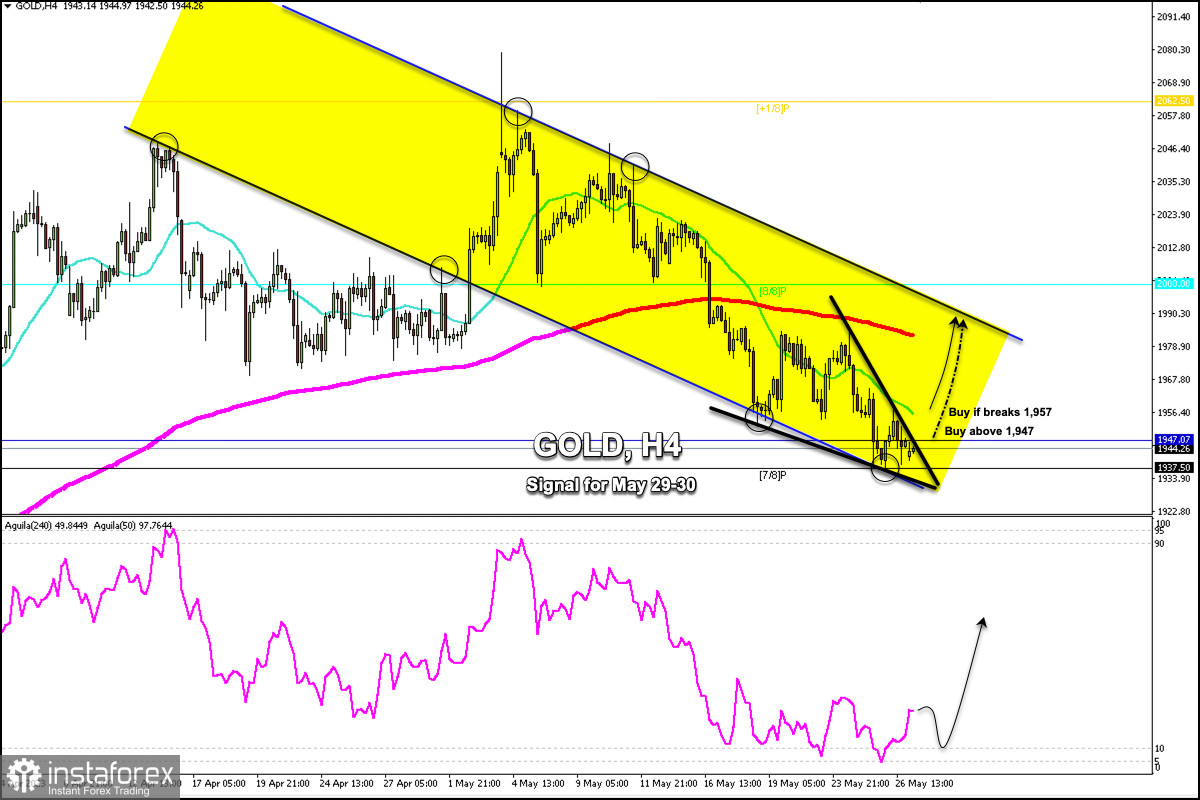
Early in the European session, Gold (XAU/USD) is trading around 1,944.26 below the 21 SMA and within a symmetrical triangle formed since May 16.
From a high of 2,062.90, gold has been under selling pressure for 16 days straight. Last week, the price reached a low of 1,936.80. The 7/8 Murray support located at 1,937.50 has become a key point. Since then, gold began to consolidate. In the next few hours, gold is expected to make a technical rebound.
The daily pivot point is located around 1,947. It is likely that a sharp break and a daily close above this level could encourage the recovery of gold and it could reach the 21 SMA located at 1,957 and finally could reach the top of the downtrend channel around 1,987.
In case XAU/USD falls and consolidates below 1,937 (7/8 Murray), it is expected to reach the weekly support zone around 1,927. It could be a key zone which could give gold a strong technical bounce. Otherwise, in case the bearish pressure prevails, the instrument is expected to fall until reaching the psychological level of 1,900.
On the contrary, for a sustained recovery in gold, it is expected a close above the 21 SMA located at 1,957 on the daily chart. So, the price is likely to reach the 1,980 zone (200 EMA) and the psychological level of $2,000.
The symmetrical triangle that we see on the 4-hour chart could be key for the bullish signal to be confirmed. Therefore, a break above 1,950 will be seen as an opportunity to buy with targets at 1,957, 1,980, and 1,987.
InstaForex analytical reviews will make you fully aware of market trends! Being an InstaForex client, you are provided with a large number of free services for efficient trading.

