 Stay
Stay 
Trading Conditions
Products
Tools


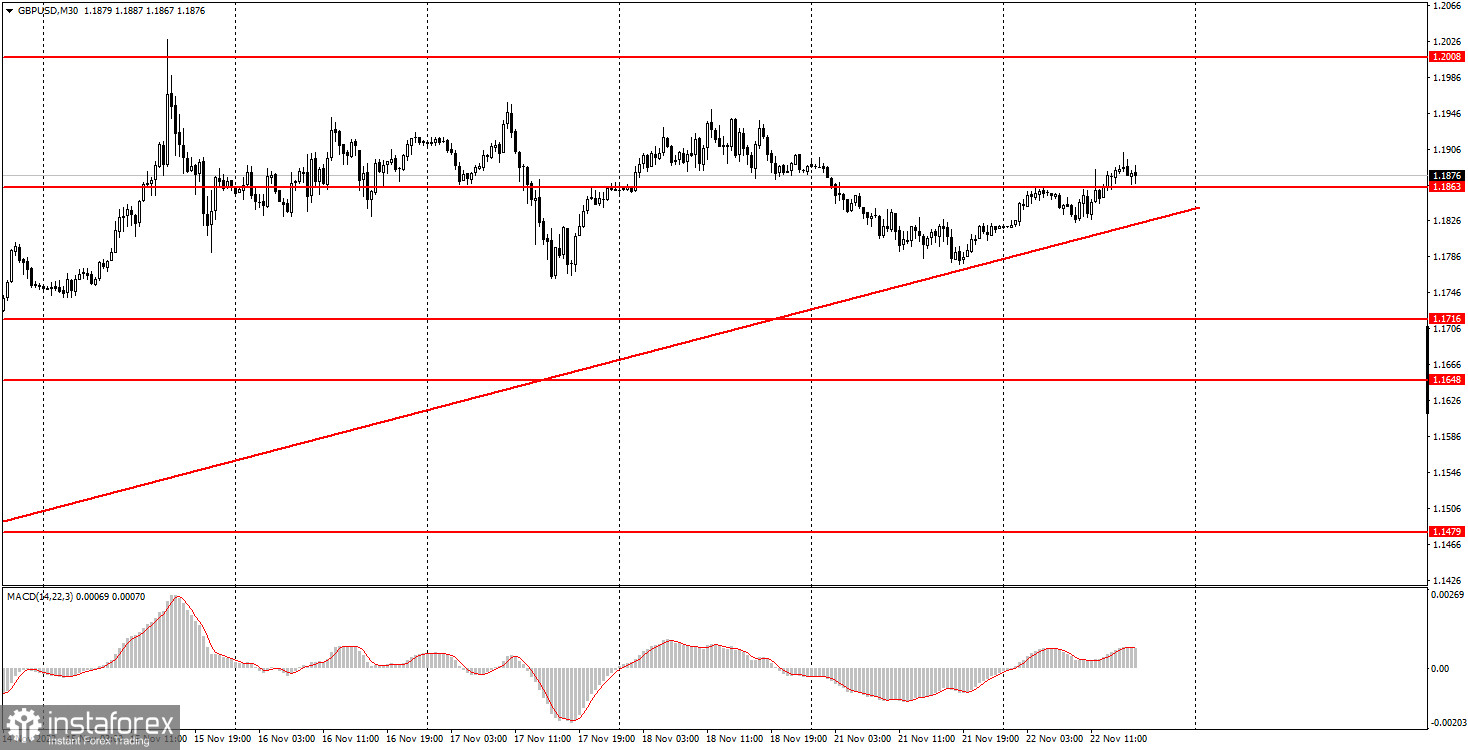
GBP/USD slightly grew on Tuesday, which was enough to maintain the upward trend and its line. Therefore, the pound still has a chance to continue rising, and in our opinion, it was and is absolutely illogical. Nevertheless, the technical picture doesn't provide any sell signals, so it wouldn't make sense to sell, no matter what the fundamental background and our expectations are. And there was no important macroeconomic news or any other fundamental background. No important reports were published either in the UK or the US on Monday, nor on Tuesday. If volatility was around 120 points on Monday, then it was 80 on Tuesday, which is quite low for the pound. Thus, there is no trend now, no volatility or logic in the way the pound moves. We expect the pair to settle below the trend line (just like the euro) and fall.
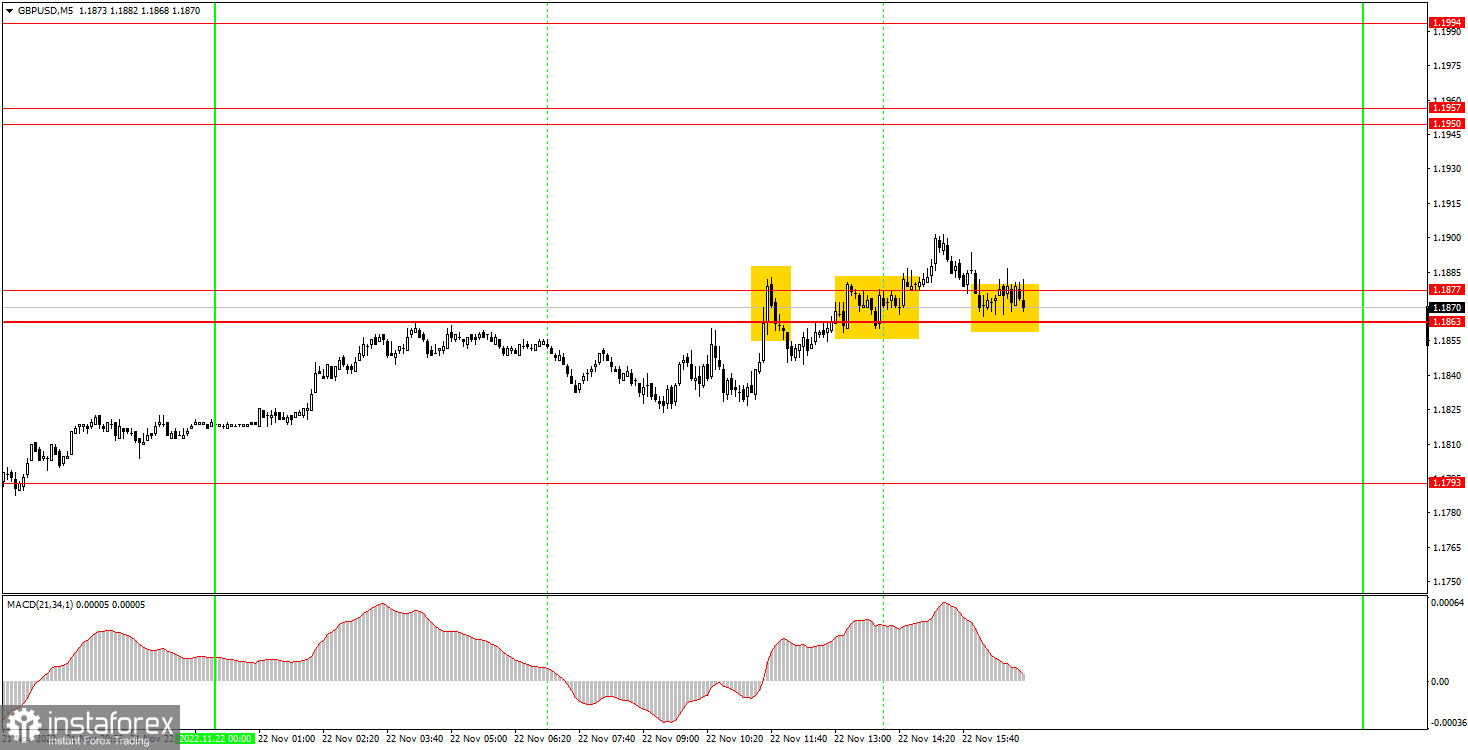
On the 5-minute timeframe, trading signals were not so good, just like it was for the euro. We observed the same flat, so it is not surprising that all the signals were formed around the same area, and they all turned out to be false. The price was not able to move 20 pips in the right direction. We can't blame the levels around which the signals were formed, it's because it's a flat, which makes any levels weak. That's why if you worked with the first two signals, you would have gotten a loss. But the loss is small and acceptable. Not every transaction is profitable. That's why nothing bad happened, just remember that the pair can trade flat.
The pound/dollar pair continues to move up on the 30-minute time frame, supported by the ascending trendline. I still think that the instrument will depreciate in the coming weeks so the price will break below this trendline sooner or later. If this happens, the pound will develop a proper downtrend. But there is also a high probability of flat. On the 5-minute chart on Wednesday, it is recommended to trade at the levels of 1.1550, 1.1608, 1.1648, 1.1716, 1.1793, 1.1863-1.1877, 1.1950-1.1957 and 1.1994. As soon as the price passes 20 pips in the right direction, you should set a Stop Loss to breakeven. Indexes of business activity in services and production will be published in Great Britain and the USA. These are not very important and we probably won't see a significant reaction. There will be some minor reports in America but we don't expect such data to have a strong influence on the pair.
1) The strength of the signal is determined by the time it took the signal to form (a rebound or a breakout of the level). The quicker it is formed, the stronger the signal is.
2) If two or more positions were opened near a certain level based on a false signal (which did not trigger a Take Profit or test the nearest target level), then all subsequent signals at this level should be ignored.
3) When trading flat, a pair can form multiple false signals or not form them at all. In any case, it is better to stop trading at the first sign of a flat movement.
4) Trades should be opened in the period between the start of the European session and the middle of the US trading hours when all positions must be closed manually.
5) You can trade using signals from the MACD indicator on the 30-minute time frame only amid strong volatility and a clear trend that should be confirmed by a trendline or a trend channel.
6) If two levels are located too close to each other (from 5 to 15 pips), they should be considered support and resistance levels.
Support and Resistance levels are the levels that serve as targets when buying or selling the pair. You can place Take Profit near these levels.
Red lines are channels or trend lines that display the current trend and show in which direction it is better to trade now.
The MACD indicator (14, 22, and 3) consists of a histogram and a signal line. When they cross, this is a signal to enter the market. It is recommended to use this indicator in combination with trend patterns (channels and trendlines).
Important announcements and economic reports that can be found on the economic calendar can seriously influence the trajectory of a currency pair. Therefore, at the time of their release, we recommend trading as carefully as possible or exiting the market in order to avoid sharp price fluctuations.
Beginners on Forex should remember that not every single trade has to be profitable. The development of a clear strategy and money management is the key to success in trading over a long period of time.
InstaForex analytical reviews will make you fully aware of market trends! Being an InstaForex client, you are provided with a large number of free services for efficient trading.


