 Stay
Stay 
Trading Conditions
Products
Tools


Analyzing trades on Thursday:
EUR/USD on M30 chart
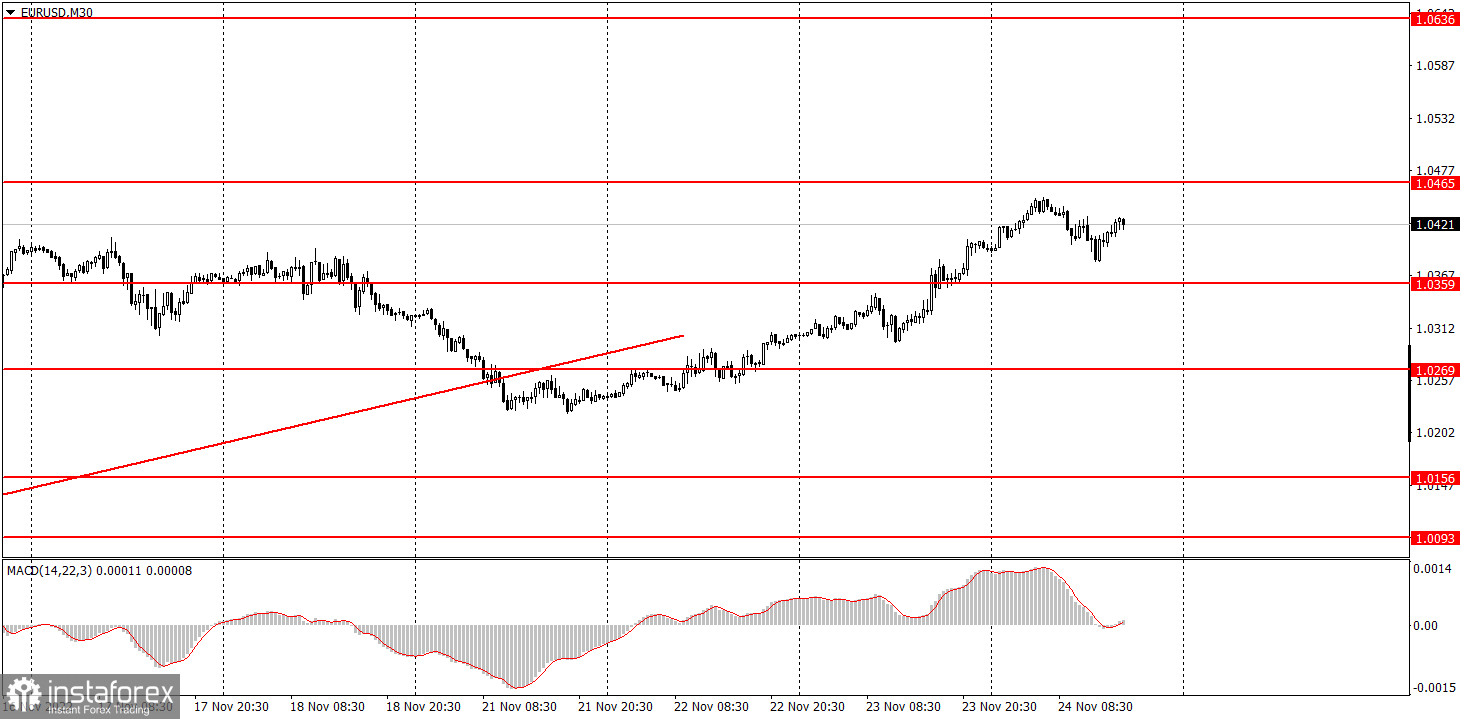
EUR/USD continued its uptrend on Thursday, with the main movement observed mainly at night. During the day, the pair was falling but not to a great extent. We can't even talk about a correction yet. The price managed to closely approach the previous local high of 1.0465, so it is very close to resuming the downtrend. Earlier, the pair declined below the ascending trendline. Yet, it failed to continue the emerging fall and was rising for a couple of days instead. However, the uptrend is considered canceled unless the price tests the local high. Yesterday's rise of the euro could be attributed to the macroeconomic background although its influence was minor. It could be a stronger pound that pushed the euro to the upside. As for today, the fundamental background was almost absent so the pair was mostly influenced by the technical factor. I still expect to see a strong downside correction on the pair.
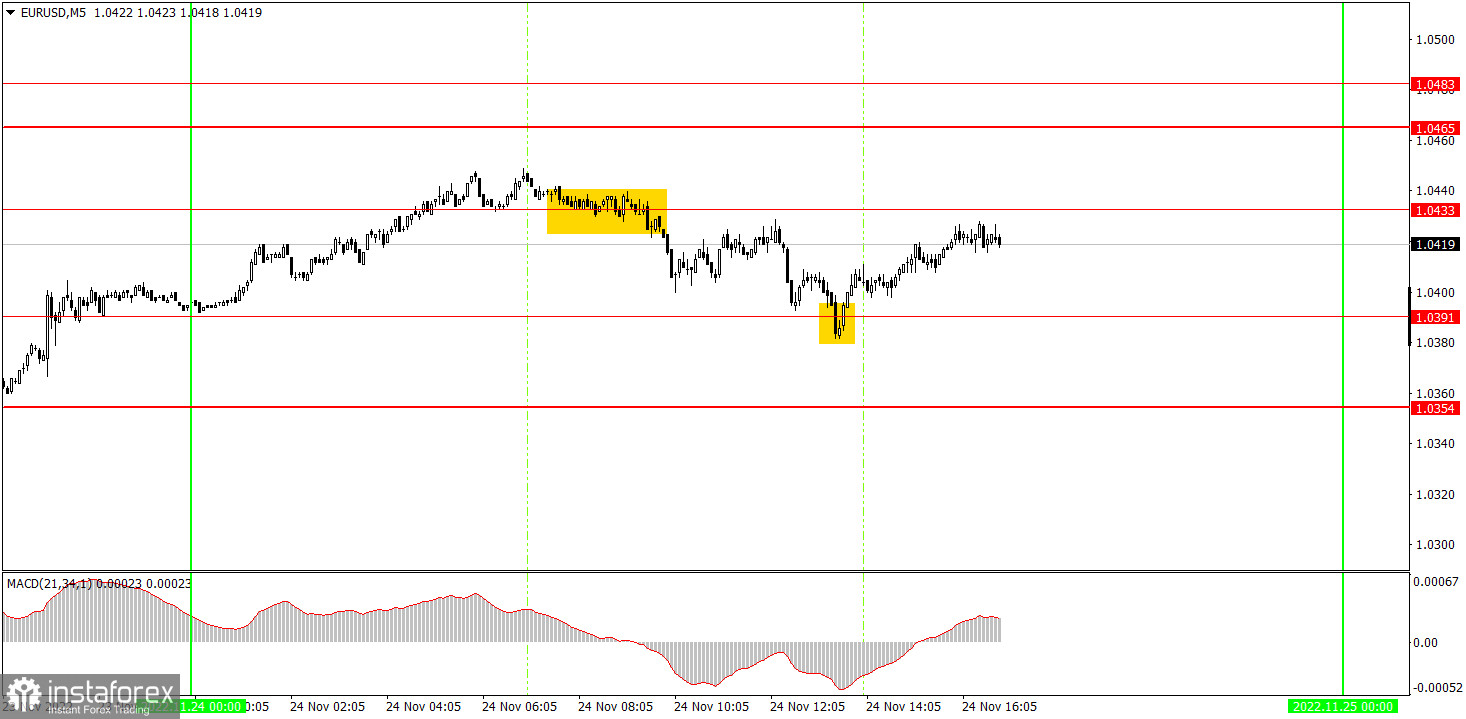
Just two trading signals were formed on the 5-minute time frame on Thursday. The daily volatility rate was about 70 pips which is not too much. At first, the pair settled below 1.0433, thus creating a sell signal. So, novice traders should have opened short positions. Later, the price declined to the nearest key level of 1.0391 and then made a pullback that was not very accurate. At this point, traders should have closed short positions and should have opened long positions instead. Later in the day, the pair approached the level of 1.0433 where it was possible to take profit manually. To sum up, we had two trading signals on Thursday and two trades that were both profitable. The overall profit was around 45 pips.
Trading tips on Friday
The uptrend has been canceled on the 30-minute time frame, just as we predicted a week ago. However, the pair is struggling to continue its decline. I still think that both macroeconomic and fundamental backgrounds have been favorable for the euro in the past few days and weeks. On the 5-minute chart on Friday, it is recommended to trade at the levels of 1.0156, 1.0221, 1.0269-1.0277, 1.0354, 1.0391, 1.0433, 1.0465, 1.0483, 1.0535, and 1.0582. As soon as the price passes 15 pips in the right direction, you should set a Stop Loss to breakeven. On Friday, Luis de Guindos will give another speech. By the way, he mentioned in his Thursday statement that the ECB would continue to raise rates. Otherwise, there will be no other important macroeconomic reports or events. Therefore, volatility is likely to be low.
Basic rules of the trading system
1) The strength of the signal is determined by the time it took the signal to form (a rebound or a breakout of the level). The quicker it is formed, the stronger the signal is.
2) If two or more positions were opened near a certain level based on a false signal (which did not trigger a Take Profit or test the nearest target level), then all subsequent signals at this level should be ignored.
3) When trading flat, a pair can form multiple false signals or not form them at all. In any case, it is better to stop trading at the first sign of a flat movement.
4) Trades should be opened in the period between the start of the European session and the middle of the US trading hours when all positions must be closed manually.
5) You can trade using signals from the MACD indicator on the 30-minute time frame only amid strong volatility and a clear trend that should be confirmed by a trendline or a trend channel.
6) If two levels are located too close to each other (from 5 to 15 pips), they should be considered support and resistance levels.
On the chart
Support and Resistance levels are the levels that serve as targets when buying or selling the pair. You can place Take Profit near these levels.
Red lines are channels or trend lines that display the current trend and show in which direction it is better to trade now.
The MACD indicator (14, 22, and 3) consists of a histogram and a signal line. When they cross, this is a signal to enter the market. It is recommended to use this indicator in combination with trend patterns (channels and trendlines).
Important announcements and economic reports that can be found on the economic calendar can seriously influence the trajectory of a currency pair. Therefore, at the time of their release, we recommend trading as carefully as possible or exiting the market in order to avoid sharp price fluctuations.
Beginners on Forex should remember that not every single trade has to be profitable. The development of a clear strategy and money management is the key to success in trading over a long period of time.
InstaForex analytical reviews will make you fully aware of market trends! Being an InstaForex client, you are provided with a large number of free services for efficient trading.


