 Stay
Stay 
Trading Conditions
Products
Tools


There were several good entry signals last Friday. Let us look at the 5-minute chart and figure out what happened. In my morning forecast, I pointed out the level of 1.2125 and recommended making market entry decisions with this level in mind. The pair rose and made a false breakout in this area, which created a sell signal in the morning and sent the pound down by more than 40 pips. In the second half of the day, there was a false breakout of 1.2066, which created a buy signal because it was hard to expect a one-way movement without data releases. As a result, the pair increased by more than 45 pips.
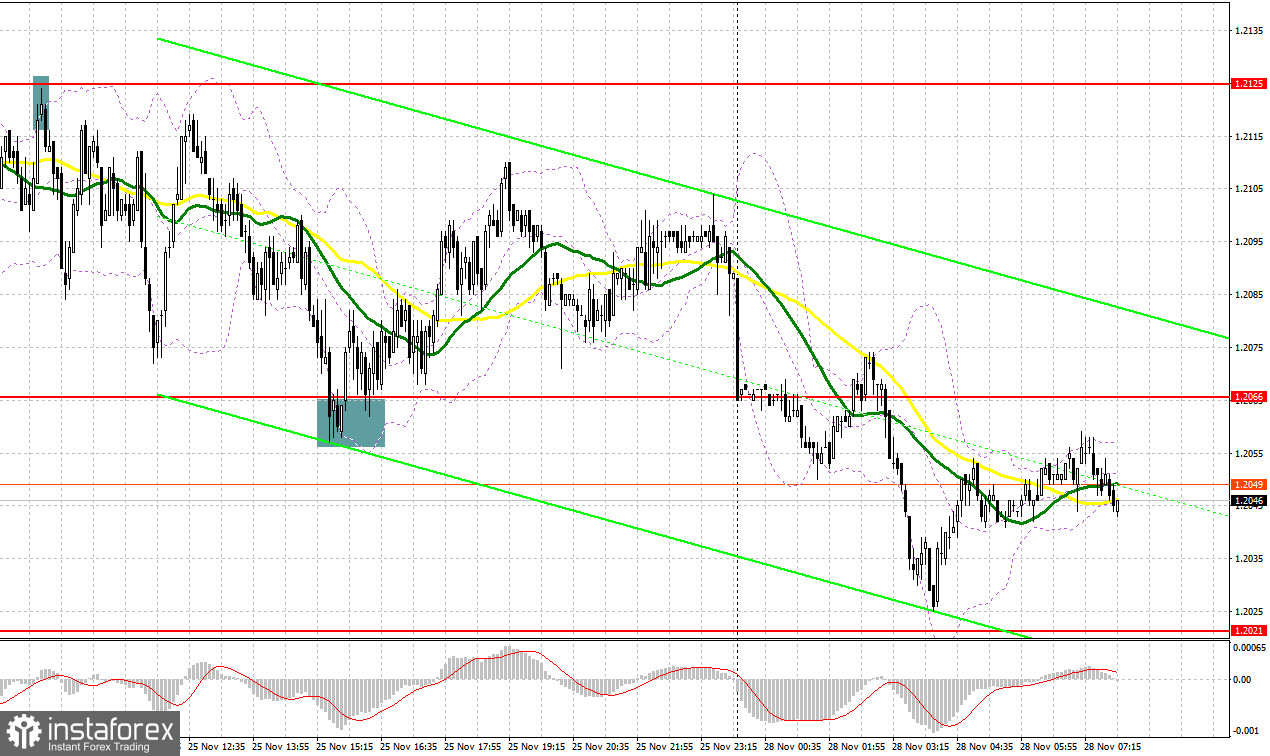
When to open long positions on GBP/USD:
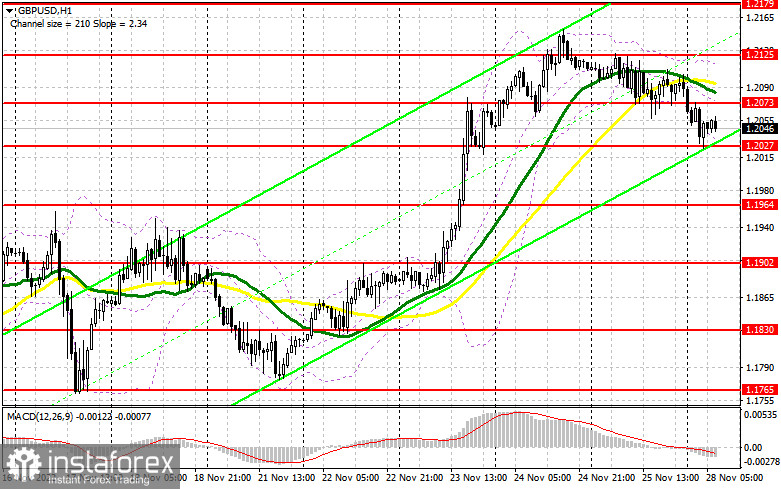
As on last Friday, there are no UK and US data releases today, so volatility and trading volume will be low. This will favor bullish traders, who will try to take advantage of the downward correction, which was seen at the end of last week and during today's Asian session. The optimal time to go long on the pair would be during a false breakout of the nearest support level of 1.2027, which would allow the pair to rebound to 1.2073, its main target. Above this level lie the moving averages which are favorable to bears, making 1.2073 much more important. Breaking above this range is the main goal for bullish traders today because once it is regained, the bull market will continue. A breakout of this level and a downward test of 1.2073 will help extend the rally, opening the way towards 1.2125 and 1.2179. If the pair moves above this range, it will allow establishing a more powerful trend with the prospect of returning to 1.2224. The most distant target is 1.2256, where I recommend taking profit. If the bulls fail and miss the target at 1.2027, the pressure on the pair will remain at the beginning of the week, which will lead to a larger correction. In that case, I would advise not to hurry: it is better to buy on a decline and a false breakout near 1.1964. I recommend to open long positions in GBP/USD immediately if it bounces off 1.1902, with an upward intraday correction of 30-35 pips being the target.
When to open short positions on GBP/USD:
Bearish traders are not very active yet, but they managed to push the pair into a downward correction during the Asian session. It is unlikely that bears will be able to break through 1.2027, as there are no data releases today. Therefore, I recommend to focus on defending the nearest resistance at 1.2073. The optimal scenario to open short positions would be during a false breakout of this area, which would lead to a retracement towards 1.2027. Bears need to take this level at the beginning of the week, as without it, they will not be able to expect something bigger. A breakout and an upward retest of 1.2027 will create an entry point for opening short positions, assuming that GBP/USD will return to 1.1964. This move will exacerbate the situation of buyers who expect the bullish trend to get stronger. The most distant target will be the area of 1.1902, where I recommend taking profit. A test of this area risks jeopardizing further bullish prospects. In the scenario of GBP/USD moving upside and bears being inactive near 1.2073, anything can be expected. This will push GBP/USD towards 1.2125 and 1.2179. Only a false breakout of these levels will form an entry point for opening short positions with a downward movement target. However, if bears also show no activity there, you can sell GBP/USD immediately at a bounce from its high and 1.2224, keeping in mind a downward intraday correction of 30-35 pips.
COT report:
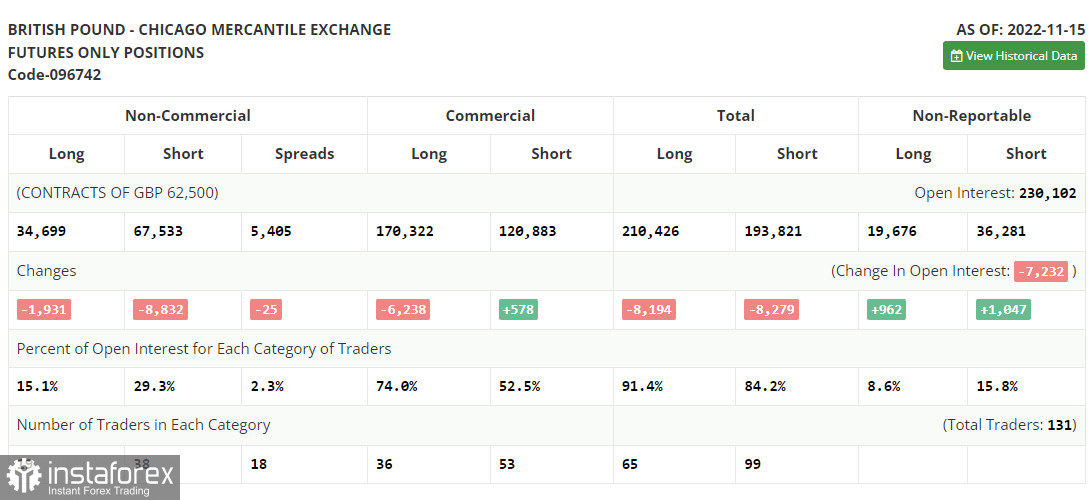
The Commitment of Traders (COT) report for November 15 recorded a decline of both short and long positions. A sharp rise in inflation in the UK was quite unexpected, which definitely affected the Bank of England and its future plans regarding interest rates. Given the situation, the regulator will simply be forced to further pursue an ultra-aggressive policy, which will keep the demand for the pound and allow it to strengthen against the U.S. dollar. But these problems in the UK economy, which were confirmed by the recent GDP data, are unlikely to lure the big market players, who seriously believe that a long-term recovery of the pound sterling is on the way. Furthermore, the Federal Reserve also maintains its monetary tightening policy to fight inflation, which also discourages going long on GBP/USD in the medium term. The latest COT report showed that long non-commercial positions declined by 1,931 to 34,699, while short non-commercials fell by 8,832 to 67,533, further lowering the negative non-commercial net position to -32,834 from -39,735 a week earlier. The weekly closing price rose to 1.1885 from 1.1549.
Indicators' signals:
Moving averages
Trading is carried out below the 30-day and 50-day moving averages, which indicates that bullish traders are facing difficulties.
Note: The period and prices of moving averages are considered by the author on the H1 (1-hour) chart and differ from the general definition of the classic daily moving averages on the daily D1 chart.
Bollinger Bands
If GBP/USD moves up, the indicator's upper border at 1.2125 will serve as resistance.
Description of indicators
• Moving average (moving average, determines the current trend by smoothing out volatility and noise). Period 50. It is marked yellow on the chart.
• Moving average (moving average, determines the current trend by smoothing out volatility and noise). Period 30. It is marked green on the chart.
• MACD indicator (Moving Average Convergence/Divergence - convergence/divergence of moving averages) Quick EMA period 12. Slow EMA period to 26. SMA period 9
• Bollinger Bands (Bollinger Bands). Period 20
• Non-commercial speculative traders, such as individual traders, hedge funds, and large institutions that use the futures market for speculative purposes and meet certain requirements.
• Long non-commercial positions represent the total long open position of non-commercial traders.
• Short non-commercial positions represent the total short open position of non-commercial traders.
• Total non-commercial net position is the difference between the short and long positions of non-commercial traders.
InstaForex analytical reviews will make you fully aware of market trends! Being an InstaForex client, you are provided with a large number of free services for efficient trading.


