 Stay
Stay 
Trading Conditions
Products
Tools


trend analysis:
EUR/USD will increase this December, starting from 1.0323 (closing of the November monthly candle) to 1.0609, which is the 38.2% retracement level (red dotted line). Then, it will go to the historical resistance level of 1.0784 (blue dotted line), before turning down again.
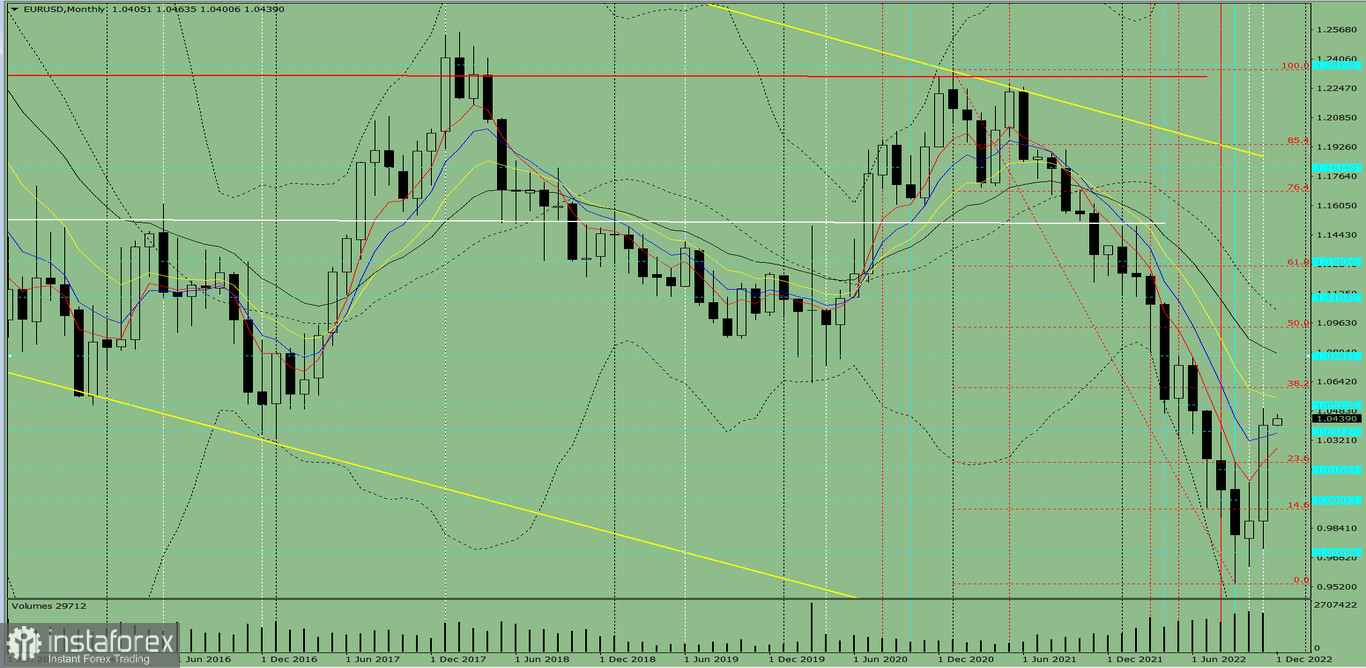
Fig. 1 (monthly chart)
Comprehensive analysis:
Indicator analysis - uptrend
Fibonacci levels - uptrend
Volumes - uptrend
Candlestick analysis - uptrend
Trend analysis - uptrend
Bollinger bands - uptrend
All this points to an upward movement in EUR/USD.
Conclusion: The pair will have a bullish trend, with no first lower shadow on the monthly white candle (the first week of the month is white) and no second upper shadow (the last week is white).
Throughout the month, quotes will climb from 1.0323 (closing of the November monthly candle) to the 38.2% retracement level at 1.0609 (red dotted line), go to the historical resistance level of 1.0784 (blue dotted line), then turn down again.
Alternatively, the pair could rise from 1.0323 (closing of the November monthly candle) to the 38.2% retracement level at 1.0609 (red dotted line), continue to the historical resistance level of 1.0784 (blue dotted line), then jump to the 50.0% retracement level at 1.0941 (blue dotted line). The downward movement may resume after testing this level.
InstaForex analytical reviews will make you fully aware of market trends! Being an InstaForex client, you are provided with a large number of free services for efficient trading.


