 Stay
Stay 
Trading Conditions
Products
Tools


The unemployment rate in the EU unexpectedly dropped in October to 6.5%, according to the data provided by Eurostat. Notably, analysts expected the indicator to stay at September levels of 6.6%.
The difference between expectations and actual figures was favorable to the euro.
In the North American trade, the weekly data on jobless claims in the US was published. A strong rise in continuing jobless claims put pressure on the US dollar. This is a negative factor for the US labor market.
Statistical data:
Continuing jobless claims increased to 1,608K from 1,551K.
Initial jobless claims dropped to 225K from 241K.
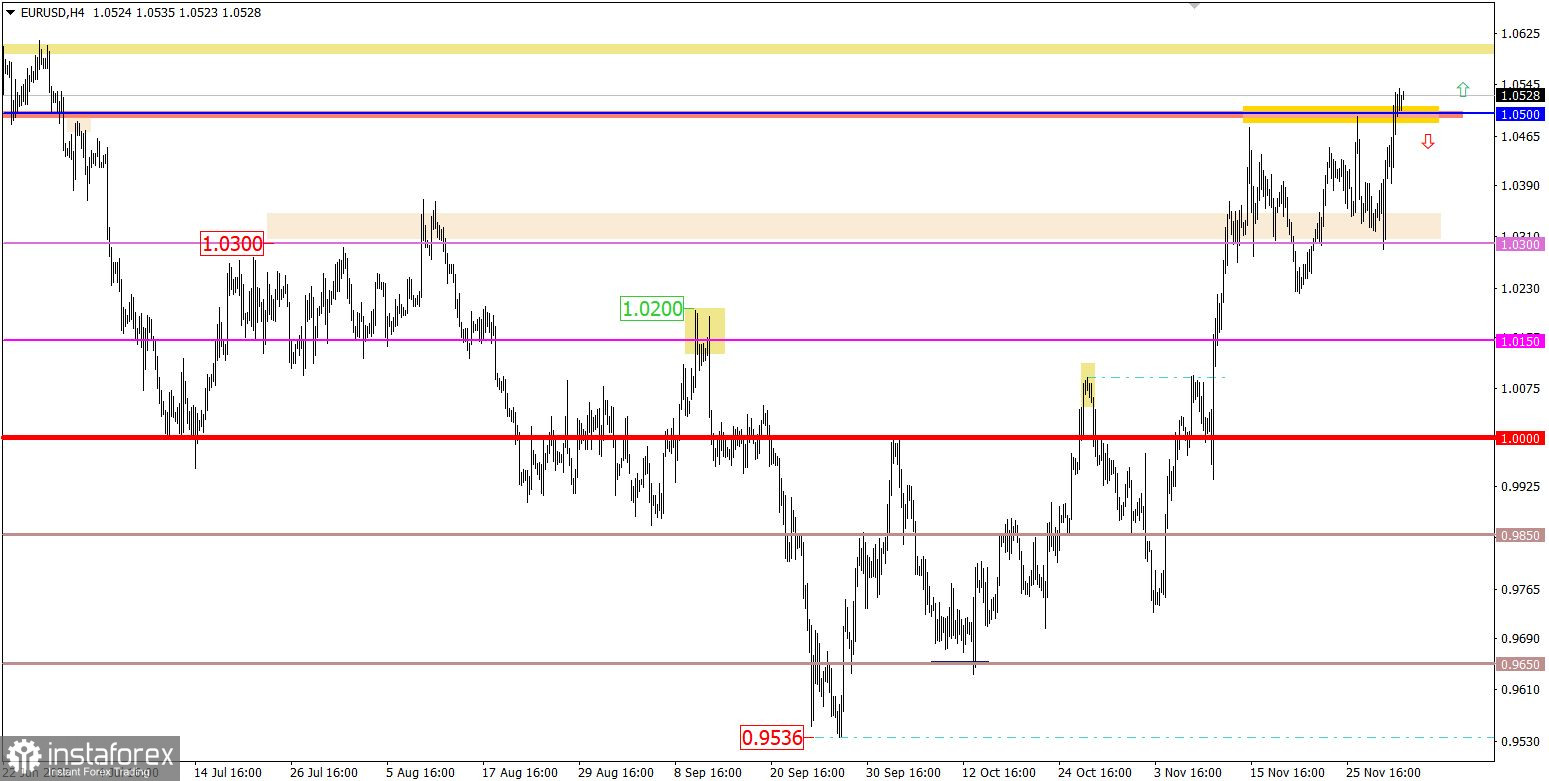
For the first time since June this year, the euro has settled above 1.0500 against the US dollar. The current resistance level failed to withstand the pressure from strong bullish momentum. So, the euro buyers managed to change the market balance in their favor.
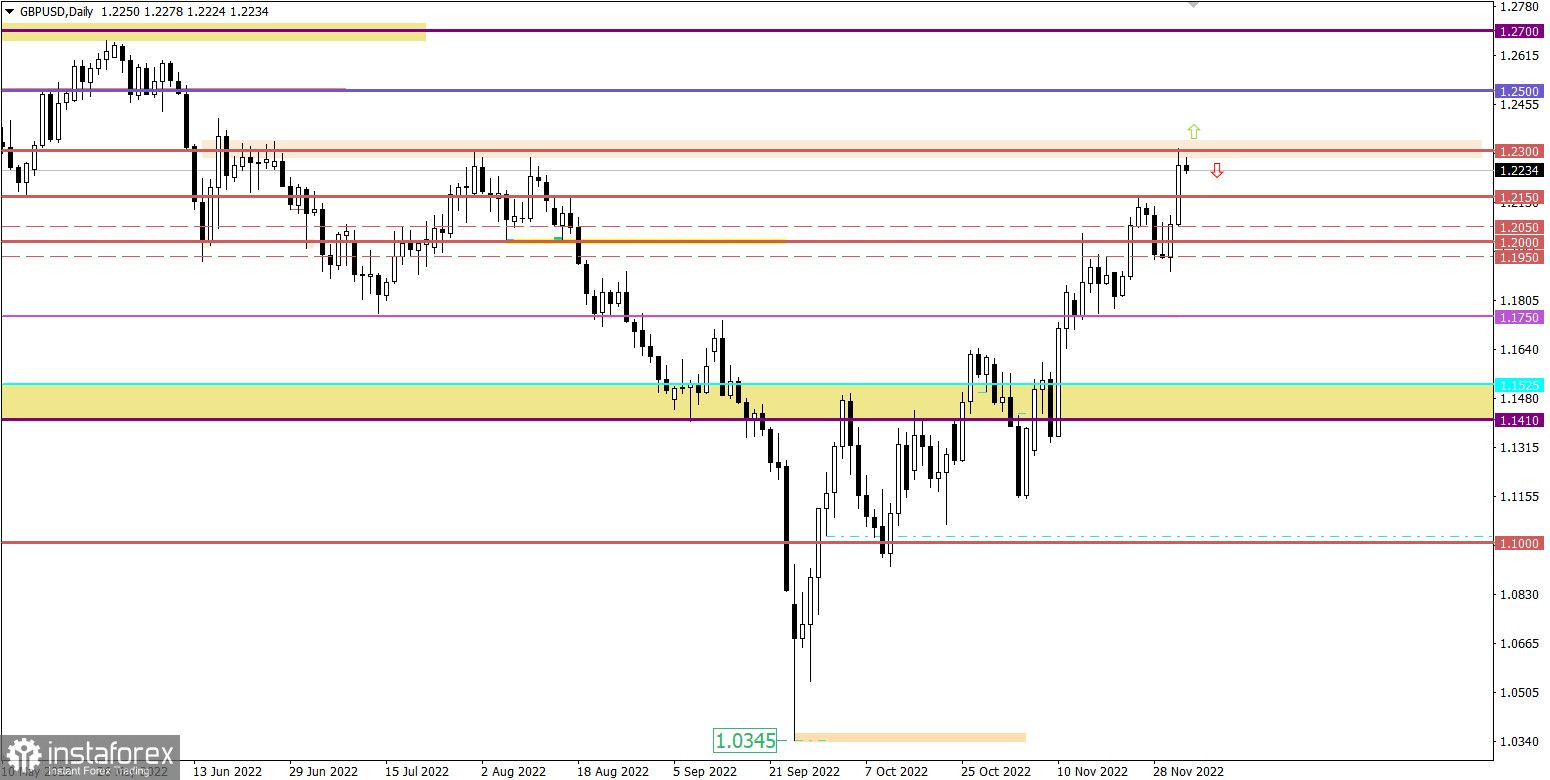
Following a strong upside movement, GBP/USD reached the resistance of 1.2300 and made a few attempts to break through it. This brought the quote to the levels last seen in June which indicates that bulls are strongly determined to change the medium-term trend.

The key event of the week is considered the release from the US Bureau of Labor Statistics. The data is expected to have a strong impact on the market.
According to forecasts, the unemployment rate should stay unchanged at 3.7%. The number of new jobs in the non-agricultural sector is expected to reach 200K. This is a good result that may pave the way for a further decline in unemployment. There is every indication that the US dollar may still get support from the buyers unless the data is revised downwards. In this case, the greenback will continue to lose ground.
Timing
US Department of Labor report – 13:30 GMT
If the price holds steady above the key level of 1.0500 on the daily chart, the euro may extend its upward movement. This scenario will indicate a change in the market sentiment in the medium term.
To activate an alternative scenario, the quote needs to return below 1.0500 on the daily chart.
As the pound has gained more than 350 pips since Wednesday, it is hardly surprising that the technical signal is showing its overbought status on the D1 chart.
This makes a pullback or a flat movement very likely. As for the continuation of the uptrend, it will be relevant only if the price settles firmly above 1.2300 on the 4-hour chart.
The candlestick chart type is white and black graphic rectangles with lines above and below. With a detailed analysis of each individual candle, you can see its characteristics relative to a particular time frame: opening price, closing price, intraday high and low.
Horizontal levels are price coordinates, relative to which a price may stop or reverse its trajectory. In the market, these levels are called support and resistance.
Circles and rectangles are highlighted examples where the price reversed in history. This color highlighting indicates horizontal lines that may put pressure on the asset's price in the future.
The up/down arrows are landmarks of the possible price direction in the future.
InstaForex analytical reviews will make you fully aware of market trends! Being an InstaForex client, you are provided with a large number of free services for efficient trading.


