 Stay
Stay 
Trading Conditions
Products
Tools


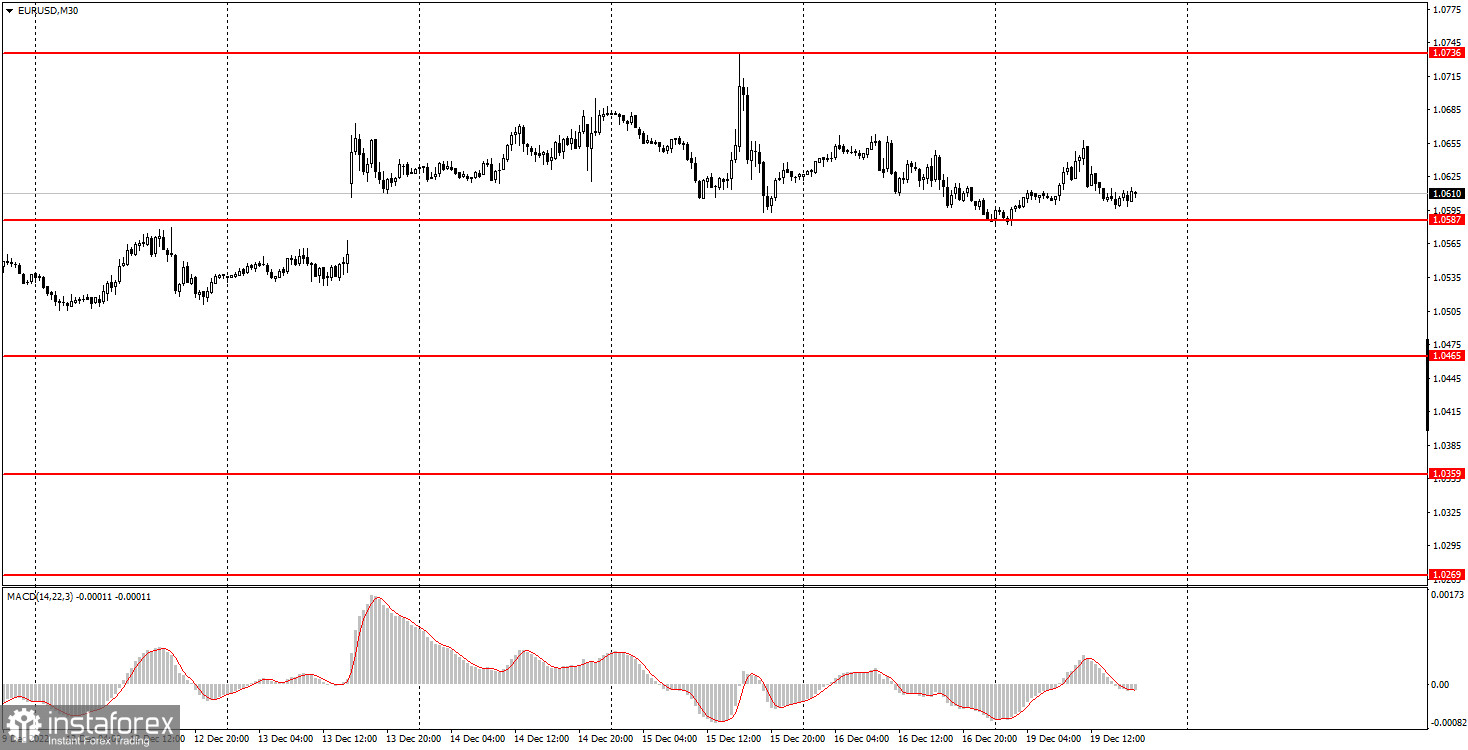
On Monday, EUR/USD initially showed a moderate upward movement, followed by a moderate downward movement. Neither the first nor the second round was provoked by the fundamental or macroeconomic backdrop, because there wasn't anything that was particularly interesting during the day. Although we could mention the speech of Luis de Guindos, vice-chairman of the European Central Bank, but his speech isn't actually significant. In any case, the pound and the euro showed almost identical movements, so it was clearly not about de Guindos' speech. Meanwhile, the euro/dollar pair has been trading between 1.0587 and 1.0736 levels for the fifth day in a row. Thus, now we have a pronounced horizontal channel at our disposal, which is at the very peaks over the past few months. I am still waiting for a strong bearish correction, but now the price needs to get out of the flat to start moving at least in some direction. Also note that there are less than two weeks left until the New Year, so the volatility in the foreign exchange market may weaken further.
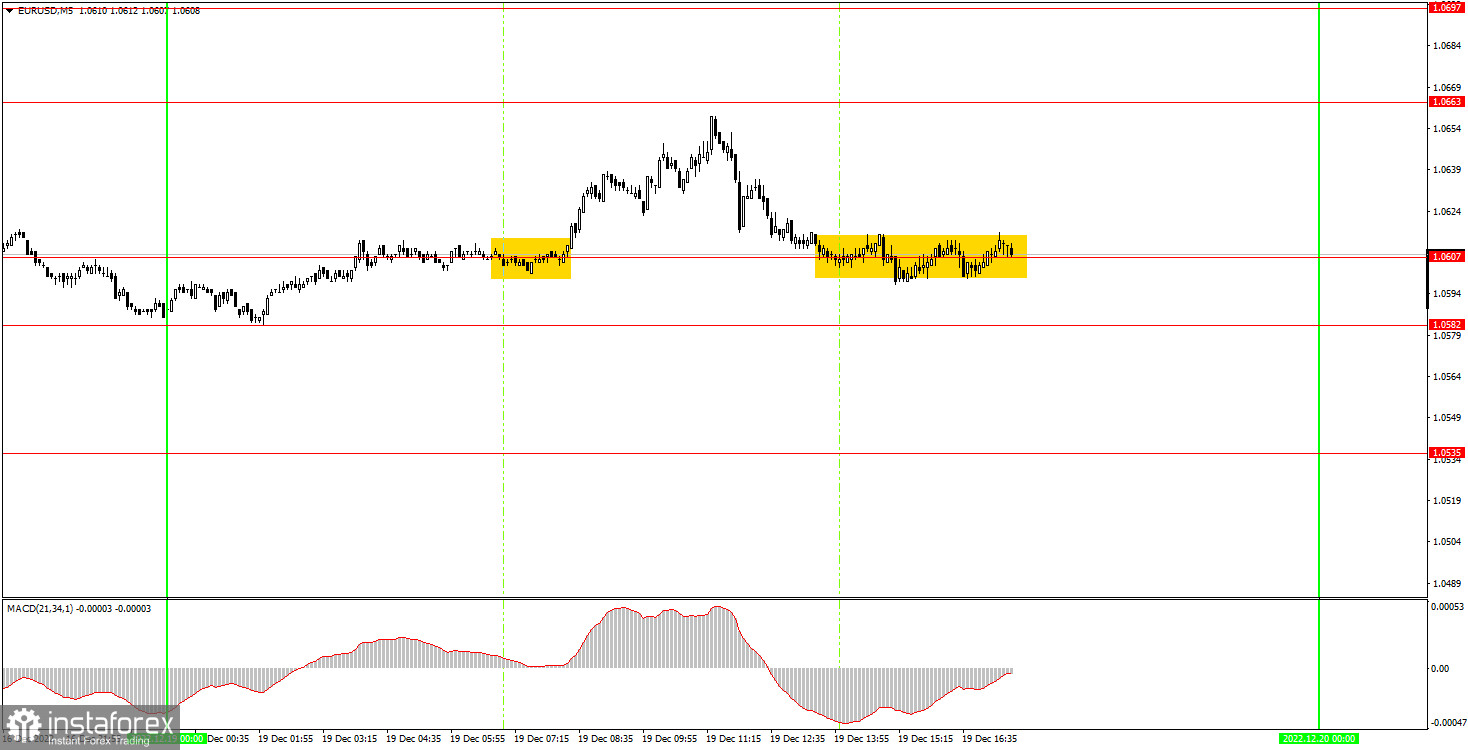
Beginners were lucky again, as the pair could show a much more eloquent flat with a lot of false signals. However, there was only one trading signal. In the very beginning of the European session, the pair rebounded/crossed 1.0607, afterwards it rose almost to 1.0663. Unfortunately, it did not reach this level, so novice traders could get profit from the deal only if they closed it manually. There was also no good sell signal near 1.0663, afterwards the pair went back to 1.0607. However, there were no losses during a "boring Monday", which is already a good thing.
On the 30-minute time chart, EUR is already trading in a horizontal channel at 1.0587-1.0736. The pair should leave this range if we wish to count on any kind of trend movement. The direction of the movement will be determined once EUR manages to cross the limits of the range. On the 5-minute chart on Tuesday, it is recommended to trade at the levels of 1.0465-1.0483, 1.0536, 1.0582-1.0607, 1.0663, 1.0697, 1.0736, 1.0787, 1.0806. As soon as the price passes 15 pips in the right direction, you should set a Stop Loss to breakeven. Once again there are no important events scheduled for Tuesday in the EU and the US, although Luis de Guindos will deliver another speech. However, I don't think he will announce anything important. Thus, there is every reason to assume that the flat will still persist.
1) The strength of the signal is determined by the time it took the signal to form (a rebound or a breakout of the level). The quicker it is formed, the stronger the signal is.
2) If two or more positions were opened near a certain level based on a false signal (which did not trigger a Take Profit or test the nearest target level), then all subsequent signals at this level should be ignored.
3) When trading flat, a pair can form multiple false signals or not form them at all. In any case, it is better to stop trading at the first sign of a flat movement.
4) Trades should be opened in the period between the start of the European session and the middle of the US trading hours when all positions must be closed manually.
5) You can trade using signals from the MACD indicator on the 30-minute time frame only amid strong volatility and a clear trend that should be confirmed by a trendline or a trend channel.
6) If two levels are located too close to each other (from 5 to 15 pips), they should be considered support and resistance levels.
Support and Resistance levels are the levels that serve as targets when buying or selling the pair. You can place Take Profit near these levels.
Red lines are channels or trend lines that display the current trend and show in which direction it is better to trade now.
The MACD indicator (14, 22, and 3) consists of a histogram and a signal line. When they cross, this is a signal to enter the market. It is recommended to use this indicator in combination with trend patterns (channels and trendlines).
Important announcements and economic reports that can be found on the economic calendar can seriously influence the trajectory of a currency pair. Therefore, at the time of their release, we recommend trading as carefully as possible or exiting the market in order to avoid sharp price fluctuations.
Beginners on Forex should remember that not every single trade has to be profitable. The development of a clear strategy and money management is the key to success in trading over a long period of time.
InstaForex analytical reviews will make you fully aware of market trends! Being an InstaForex client, you are provided with a large number of free services for efficient trading.

