 Stay
Stay 
Trading Conditions
Products
Tools


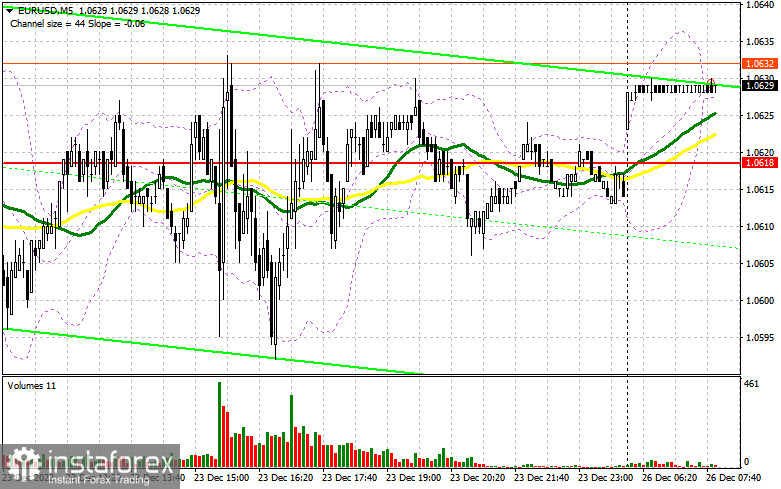
On Friday, traders received several signals to enter the market. Let us take a look at the 5-minute chart to figure out what happened. Earlier, I asked you to pay attention to the level of 1.0619 to decide when to enter the market. A rise and false breakout of 1.0619 led to a perfect sell signal. However, the euro did not fall. In fact, the euro dropped but after a jump, which affected stop orders. Then, the euro started trading below 1.0619, where a sell signal was formed. In this case, the pair showed only a slight drop. It was hovering around 1.0618 in the second part of the day.
Conditions for opening long positions on EUR/USD:
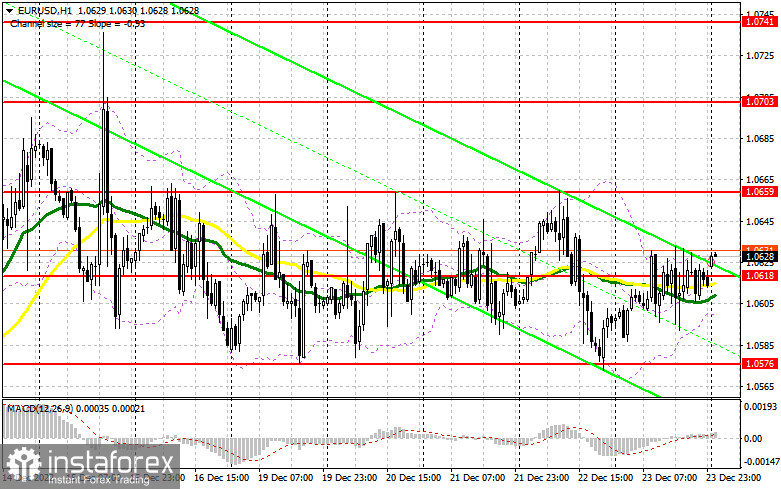
The US data on personal spending and income almost met forecasts, which kept low volatility in the market. Today, markets are closed because of the celebration of Christmas in the US and Europe. That is why today, we are unlikely to see anything interesting. From the technical point of view, it will be better to open long positions on the euro after a decline and a false breakout near the middle of the channel of 1.0618. This will give an entry signal with the target at 1.0659, which will cap the upward potential of the pair. A breakout and a downward test of this area will give an additional long signal with the target at the high of 1.0703. A breakout of this level will affect bears' stop orders, thus forming a new buy signal with the target at 1.0741. If the price tests this level, a new upward trend will be formed at the end of the year. There, traders should lock in profits. If the euro/dollar pair declines and buyers fail to protect 1.0618, pressure on the pair will return, thus allowing sellers to gain control and push the price to 1.0576. There, traders may go long only after a false breakout. It is also possible to open long positions after a bounce off 1.0535 or lower – from 1.0495, expecting a rise of 30-35 pips within the day.
Conditions for opening short positions on EUR/USD:
Sellers are likely to become more active, especially near the closest resistance level of 1.0659. The absence of data from the eurozone is likely to limit the pair's upward potential. That is why there is a reason for a false breakout. Thus, it will be better to sell after an unsuccessful consolidation above 1.0659. This may lead to the pair's movement to the middle of the channel located at 1.0618. A breakout and a test of this area will put the pair under pressure again, thus forming an additional signal to sell the asset with the target at 1.0567, where bears may retreat again. If the price settles below this area, it is likely to slide to 1.0535. This will give hope for the bearish market at the end of the year. The farthest target is located at 1.0495, where it is recommended to lock in profits. If the euro/dollar pair increases during the European session and bears fail to protect 1.0659, the market situation will hardly change significantly. However, it will be wise to avoid selling until the price hits the upper limit of the range located at 1.0703. There, traders may go short after an unsuccessful settlement. It is also possible to sell the asset just after a rebound from the high of 1.0741, expecting a decline of 30-35 pips within the day.
COT report
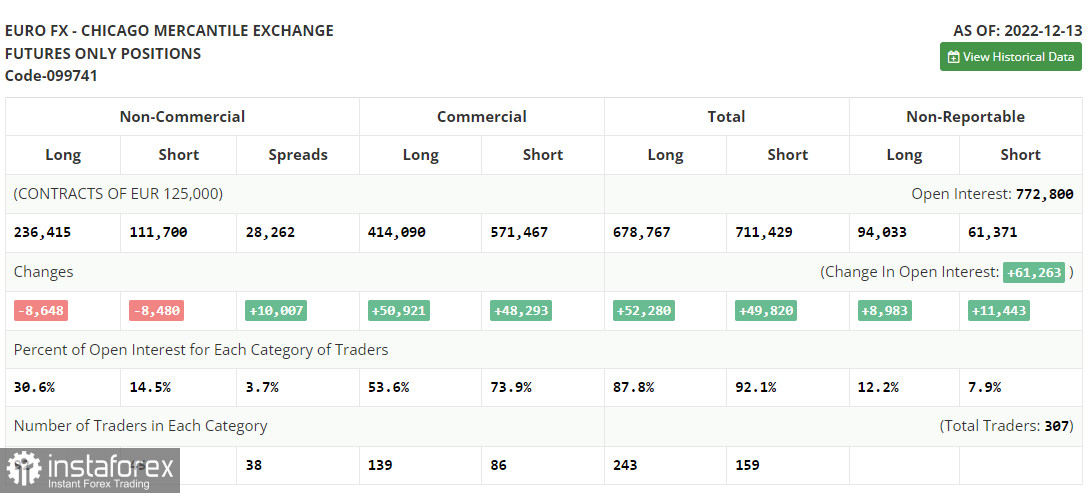
According to the COT report from December 13, the number of both long and short positions dropped. Most traders decided to lock in profits before the meetings of the global central banks, which were held last week. This, in turn, led to a decline in the volume of positions. It is obvious that the hawkish policy chosen by the Fed and the ECB will continue to affect the growth of risk assets. The fact is that the intention of the central banks to combat inflation may lead to a recession in both the US and Europe. The COT report unveiled that the number of long non-commercial positions decreased by 8,648 to 236,415, whereas the number of short non-commercial positions dropped by 8,480 to 111, 700. At the end of the week, the total non-commercial net position became slightly smaller and amounted to 122,247 against 123,113. This indicates that investors remain balanced. Although they avoid buying the euro at the moment, they are not in a hurry to sell risky assets even at the current prices. A new fundamental reason is needed for further growth in the euro. The weekly closing price rose to 1.0342 from 1.0315.
Signals of indicators:
Moving Averages
Trading is performed around 30- and 50-day moving averages, which still points to a sideways movement.
Note: The period and prices of moving averages are considered by the author on the one-hour chart which differs from the general definition of the classic daily moving averages on the daily chart.
Bollinger Bands
If the pair advances, a resistance level could be seen at 1.0630, the upper limit of the indicator. In case of a decline, the lower limit of the indicator located at 1.0605 will act as support.
Description of indicators
InstaForex analytical reviews will make you fully aware of market trends! Being an InstaForex client, you are provided with a large number of free services for efficient trading.

