 Stay
Stay 
Trading Conditions
Products
Tools


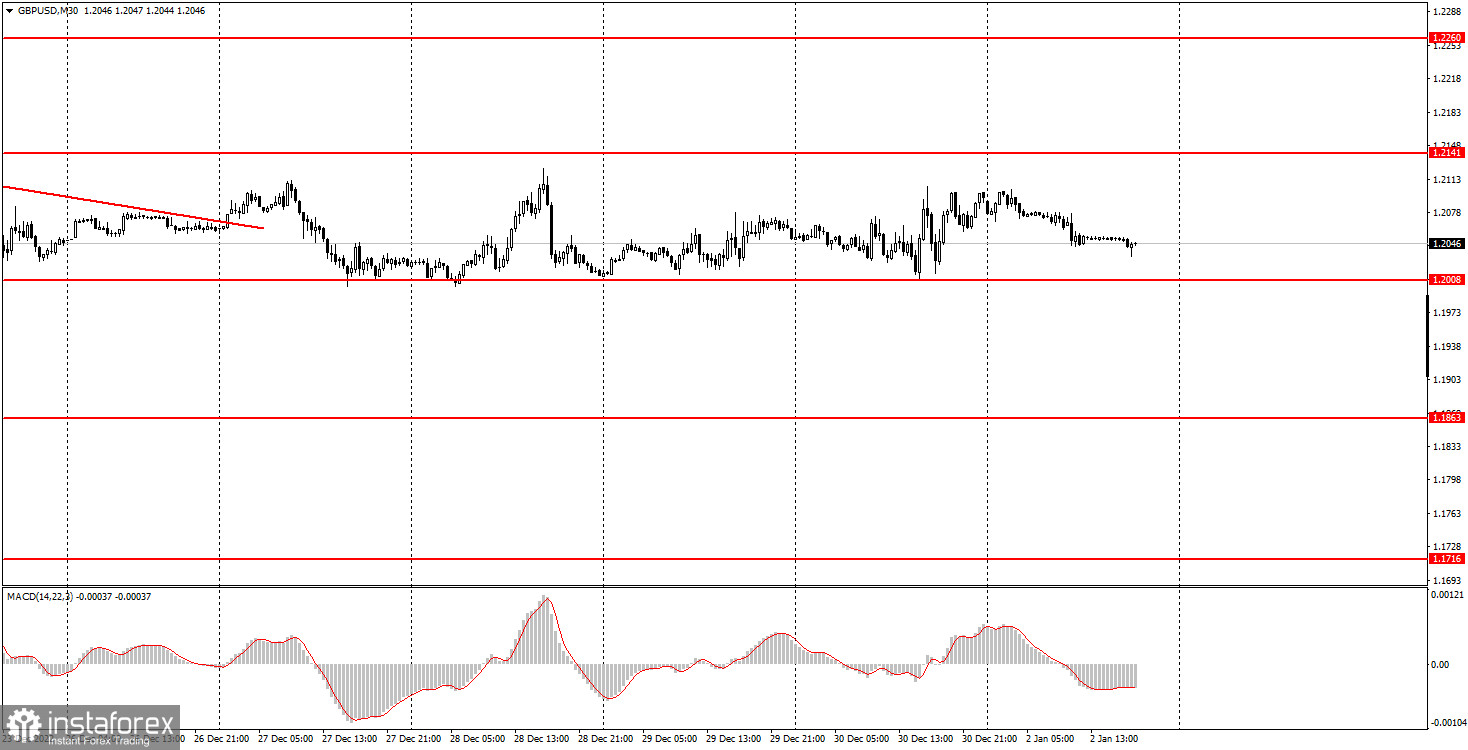
GBP/USD traded in the horizontal channel, which is perfectly shown in the chart above. So, after the New Year, the technical picture didn't change at all. There are still no fundamental and macroeconomic events, so there is nothing for traders to react to. I still expect the British currency to fall further, but now we need the pair to leave the 1.2008-1.2141 horizontal channel. I believe that the fall is more likely. There isn't much macro data in the UK this week, but there will be some important ones in the US, which could move the pair. All hope is on them because we don't see much movement now.
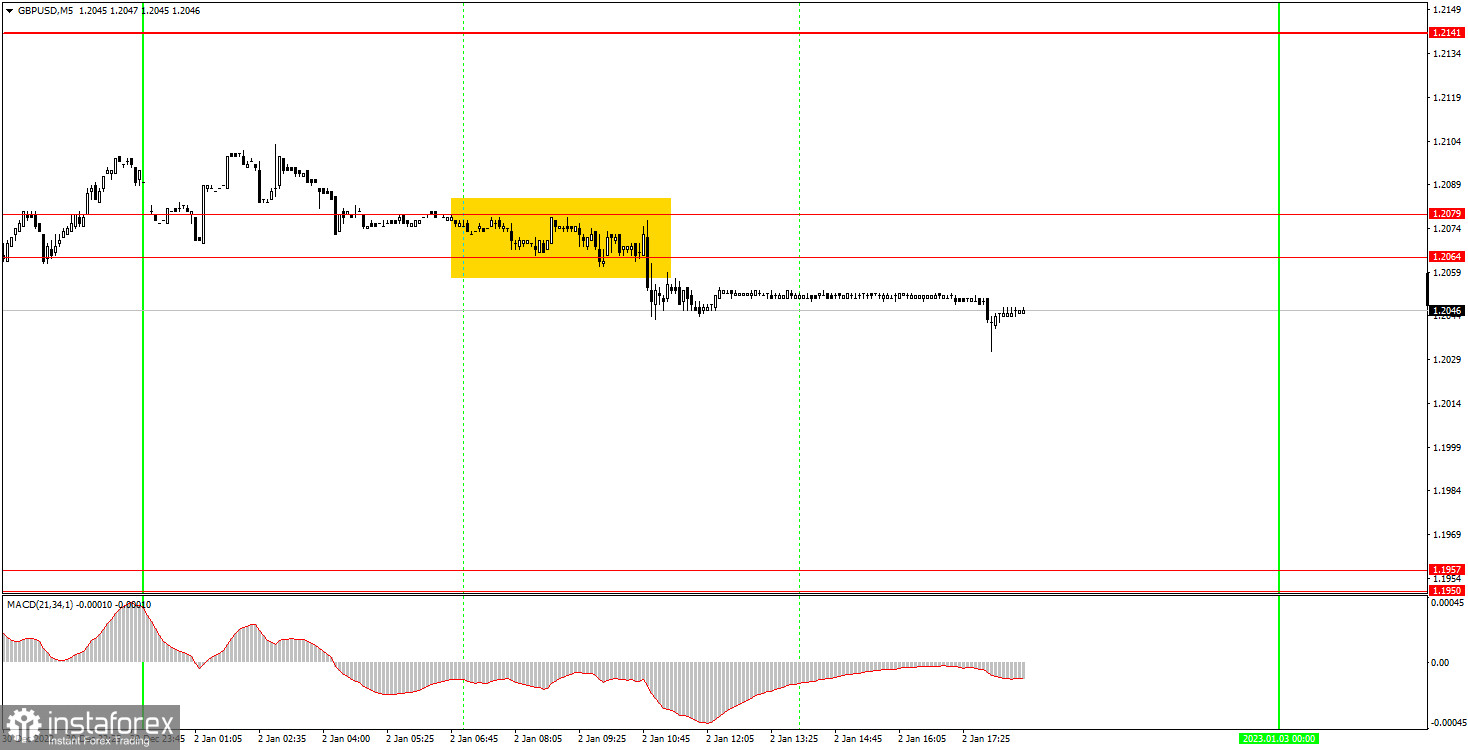
On the 5-minute chart, you can clearly see that the pair practically did not move during Monday's trading session. The pair left the area of 1.2064-1.2079 at the European trading session, afterwards it didn't even go into a flat, the movements just stopped altogether. The volatility of the following movements was about 10 pips. Naturally, it didn't make any sense to trade in such conditions. Nevertheless, novice players could open one short position on Monday, and it was profitable. There were no buy signals till the end of the day, and the price did not return to 1.2064.
On the 30-minute chart, GBP maintains a downtrend, even though the trend line has lost its relevance. At the same time, take note that the pair has been in the horizontal channel for eight trading days, so the flat is likely to persist. On the 5-minute chart, it is recommended to trade at the levels 1.1793, 1.1863-1.1877, 1.1950-1.1957, 1.2008, 1.2064-1.2079, 1.2141, 1.2186-1.2205. As soon as the price passes 20 pips in the right direction, you should set a Stop Loss to breakeven. On Tuesday, the UK and the US are set to publish data on business activity in manufacturing for December. Both have small chances to influence the market sentiment.
1) The strength of the signal is determined by the time it took the signal to form (a rebound or a breakout of the level). The quicker it is formed, the stronger the signal is.
2) If two or more positions were opened near a certain level based on a false signal (which did not trigger a Take Profit or test the nearest target level), then all subsequent signals at this level should be ignored.
3) When trading flat, a pair can form multiple false signals or not form them at all. In any case, it is better to stop trading at the first sign of a flat movement.
4) Trades should be opened in the period between the start of the European session and the middle of the US trading hours when all positions must be closed manually.
5) You can trade using signals from the MACD indicator on the 30-minute time frame only amid strong volatility and a clear trend that should be confirmed by a trendline or a trend channel.
6) If two levels are located too close to each other (from 5 to 15 pips), they should be considered support and resistance levels.
Support and Resistance levels are the levels that serve as targets when buying or selling the pair. You can place Take Profit near these levels.
Red lines are channels or trend lines that display the current trend and show in which direction it is better to trade now.
The MACD indicator (14, 22, and 3) consists of a histogram and a signal line. When they cross, this is a signal to enter the market. It is recommended to use this indicator in combination with trend patterns (channels and trendlines).
Important announcements and economic reports that can be found on the economic calendar can seriously influence the trajectory of a currency pair. Therefore, at the time of their release, we recommend trading as carefully as possible or exiting the market in order to avoid sharp price fluctuations.
Beginners on Forex should remember that not every single trade has to be profitable. The development of a clear strategy and money management is the key to success in trading over a long period of time.
InstaForex analytical reviews will make you fully aware of market trends! Being an InstaForex client, you are provided with a large number of free services for efficient trading.


