 Stay
Stay 
Trading Conditions
Products
Tools


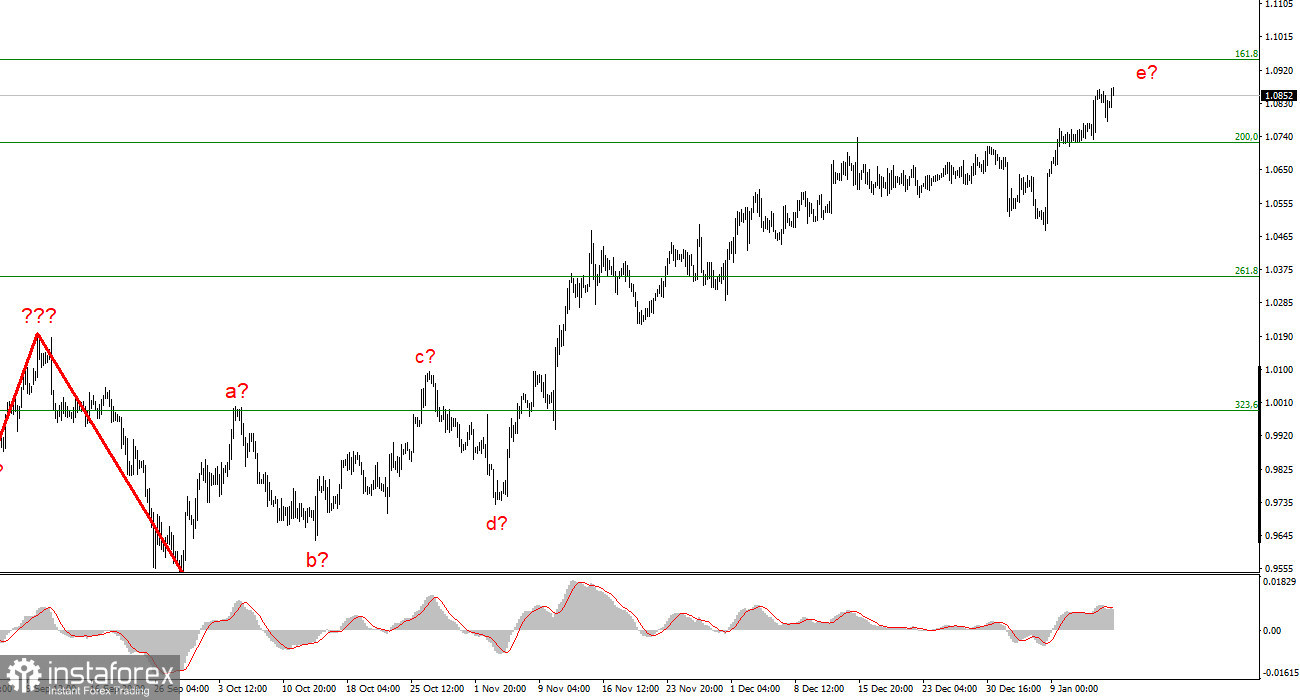
The EUR/USD wave layout on the 4-hour chart looks rather clear and complex. The entire ascending section of the trend has a complex structure. It has taken a clearly corrective and extended form which looks more like a momentum section. So, we have a complex corrective wave pattern consisting of a-b-c-d-e parts where wave e has a more complex structure than the previous four waves. If the current wave setup is correct, then this structure may be nearing its completion or has already been completed as the peak of the wave e is much higher than the peak of the wave c. If so, we can expect the formation of at least three descending waves. So, I still anticipate a decline in the pair. In the first two weeks of the year, the demand for the euro has increased and the pair has retreated slightly from the previous highs. A successful attempt to break through the 1.0721 level, which corresponds to the 127.2% Fibonacci level, indicates that the e wave may become even more extended. It seems that the corrective section of the trend will be formed later.
Slowing inflation supports EUR
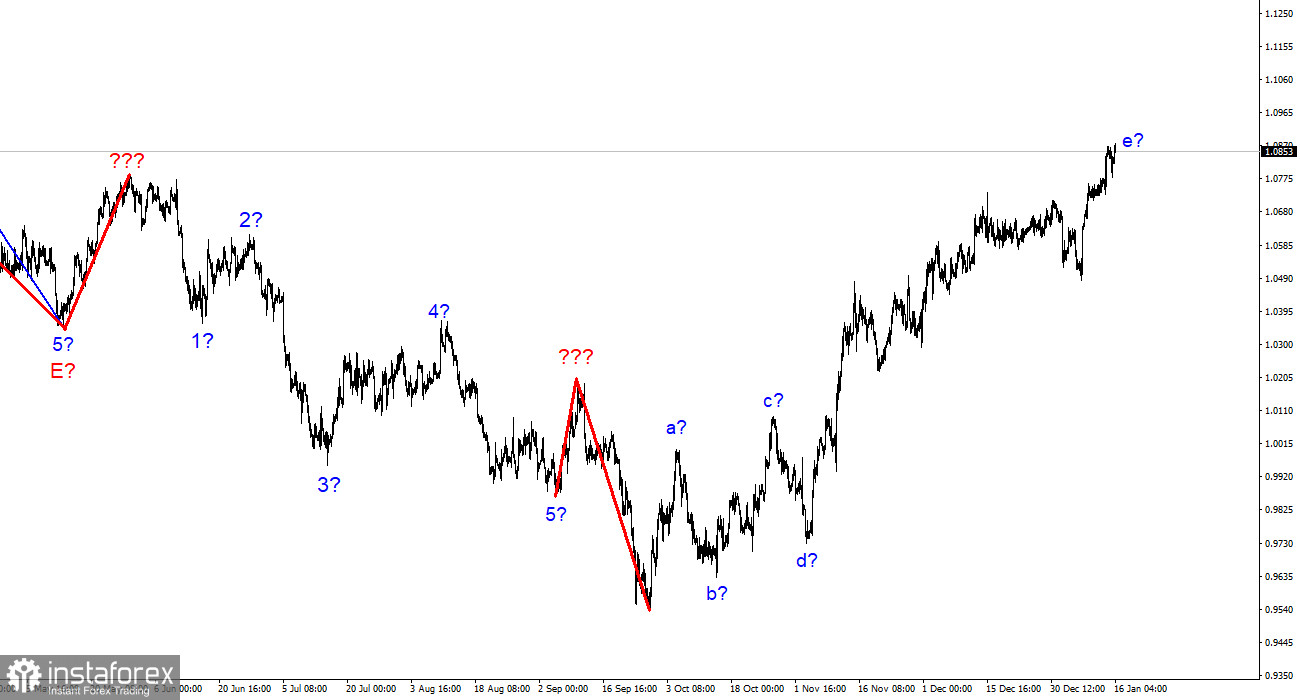
On Friday, EUR/USD dropped by 20 pips but recouped these losses on Monday. There are currently no reasons to expect that the e wave will be completed. As this wave has become too extended, I suggest we use Fibo levels to determine its completion. For this, we need to wait for a false upside breakout or a successful break of a level from top to bottom. I tried to present the e wave in the form of sub-waves. If my assumption is true, then wave 5 in e started its formation on January 6. This wave is unlikely to have a clear 5-wave structure. Otherwise, the e wave will become even more extended. Everything will depend on demand for the euro and the dollar. In recent weeks, the demand for the euro has been steadily rising. This is natural ahead of the ECB and the Fed meetings.
The main driver for the European currency is the inflation report issued in the US last week. This data has considerably changed the market sentiment. Now, there is a 100% likelihood that the Fed will raise the rate by just 25 basis points at its next meeting. I would rather agree with the majority of my colleagues who expect to see a slowdown in rate hikes. I think that the US inflation has declined to an appropriate level. If it stays like this, the Fed may not need to resort to new monetary tightening. As I see it, the US regulator will now try to finish off inflation with small rate hikes of 25 basis points. Two or three such rate hikes should be enough to bring inflation down to 3%-4%. As soon as the CPI reaches this level, it will be much easier to keep it under control.
Conclusion
Based on the analysis above, I can conclude that the ascending section of the trend is nearing its completion. With this in mind, I would recommend selling the pair with the targets located at 0.9994, which corresponds to the 323.6% Fibonacci level, following sell signals of the MACD indicator. It is also highly possible that the ascending section of the trend will get a more extended form. We need to look for signals near the Fibo levels.
On higher time frames, the wave layout of the descending section of the trend is getting longer and more complex. We have identified five ascending waves that most likely make up the a-b-c-d-e pattern. The pair may start a downtrend as soon as this trend section is completed.
InstaForex analytical reviews will make you fully aware of market trends! Being an InstaForex client, you are provided with a large number of free services for efficient trading.


