 Stay
Stay 
Trading Conditions
Products
Tools


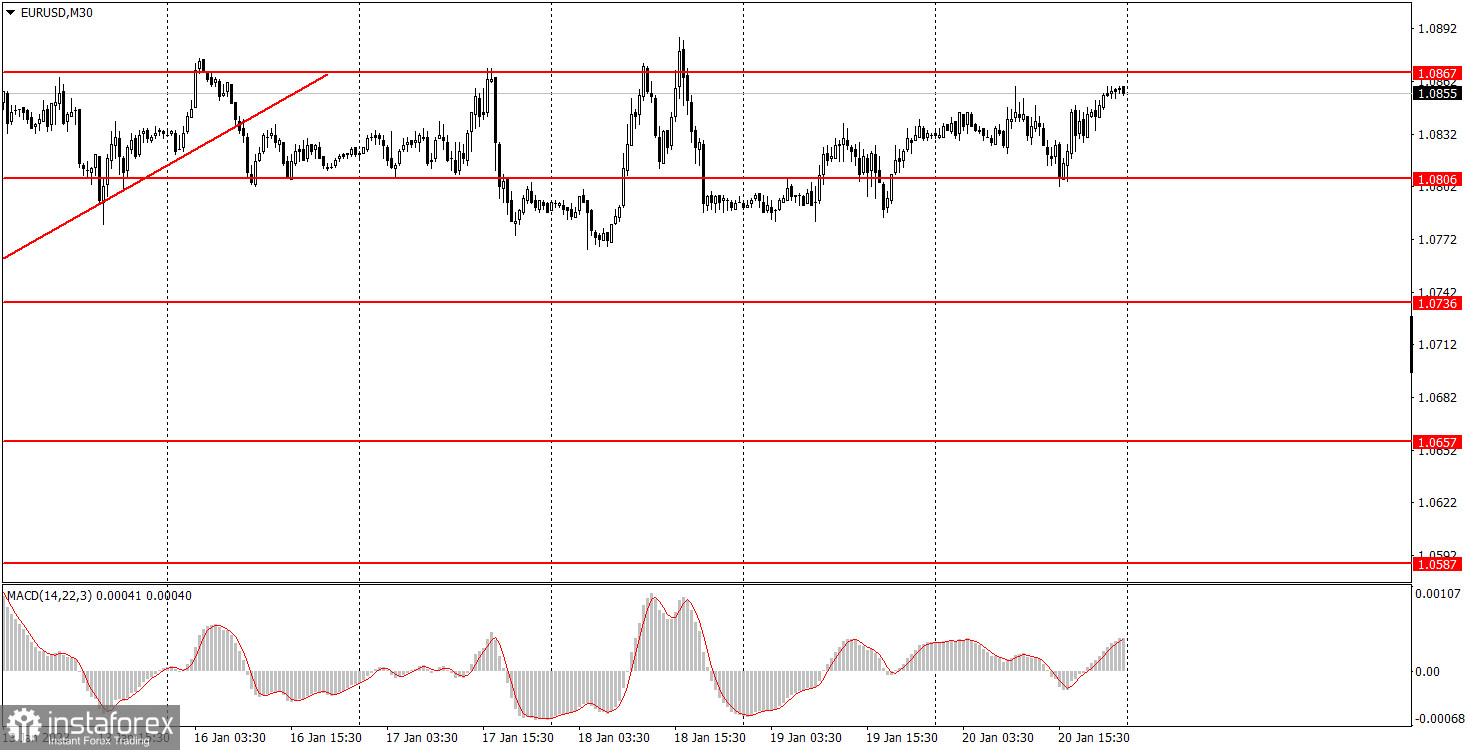
On Friday, EUR/USD continued to trade mainly sideways with low volatility. It spent the entire day between 1.0806 and 1.0867. There were no important events in the EU or the US on Friday, only European Central Bank President Christine Lagarde's speech at the Davos forum. This is Lagarde's second speech this week. The first one was held on Thursday and she didn't reveal any important information that traders have not heard yet. Judging by the fact that the pair has been flat for the entire day, Lagarde said nothing important on Friday. But what can she say now except that rates will keep going up? The ECB has no other options but to keep tightening the monetary policy. The euro has been rising for several months on that factor (as well as on the market expectations of an end to the Federal Reserve rate hike). Thus, the technical picture has not changed at all on Friday.
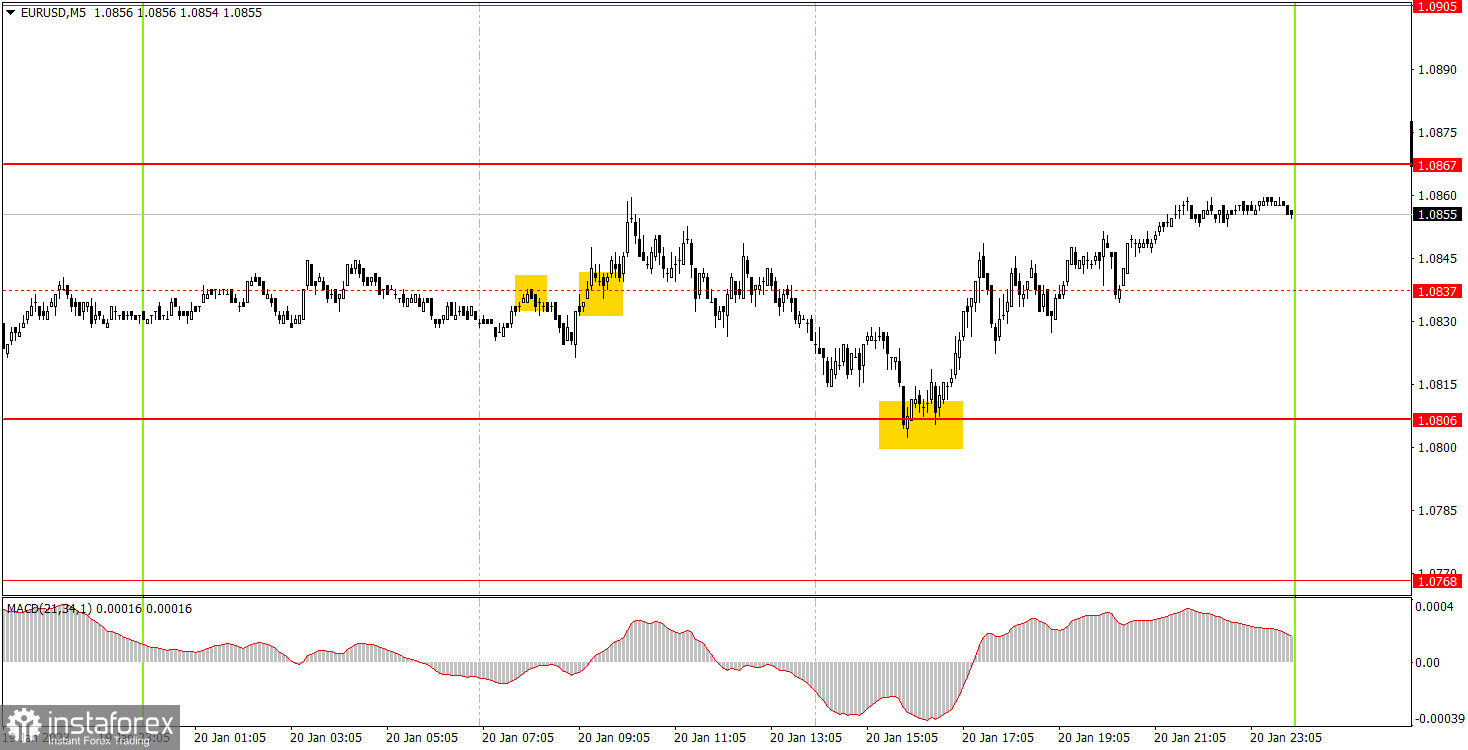
Since the movement was mostly flat, it is not surprising that a lot of signals were formed. At the end of the day I removed 1.0837 from the chart, and beginners could work out only the first two signals near this level. I only marked the first two signals, because all subsequent signals should not be worked out. The price could not pass in the right direction by even 15 points neither in the first, nor in the second case, so both trades closed with a small loss. The next signal worthy of attention was formed near 1.0806 during the US trading session. Due to this signal, beginners were able to win back the morning losses. The price went up about 30 points, and closer to the evening the deal should have been closed manually. Therefore, the total possible profit/loss fluctuated within +-10 points. Not the most successful day, but it is difficult to expect other results from the flat.
The pair maintains the uptrend on the 30-minute chart, despite crossing the trend line. As we can see, neither four bounces from 1.0867, nor crossing 1.0806 can change the market sentiment to bearish yet and could not contribute to the end of the flat. As a result, we have a flat on the highest price values of the last time without any hint of correction. On the 5-minute chart, it is recommended to trade at the levels 1.0657-1.0668, 1.0697, 1.0736, 1.0768, 1.0806, 1.0905, 1.0923-1.0933, 1.0966, 1.0989. Lagarde will speak in the EU and there's nothing in the US. I believe that Lagarde's new speech will be no better than the old ones, so I don't expect a strong reaction. The flat is likely to continue.
1) The strength of the signal is determined by the time it took the signal to form (a rebound or a breakout of the level). The quicker it is formed, the stronger the signal is.
2) If two or more positions were opened near a certain level based on a false signal (which did not trigger a Take Profit or test the nearest target level), then all subsequent signals at this level should be ignored.
3) When trading flat, a pair can form multiple false signals or not form them at all. In any case, it is better to stop trading at the first sign of a flat movement.
4) Trades should be opened in the period between the start of the European session and the middle of the US trading hours when all positions must be closed manually.
5) You can trade using signals from the MACD indicator on the 30-minute time frame only amid strong volatility and a clear trend that should be confirmed by a trendline or a trend channel.
6) If two levels are located too close to each other (from 5 to 15 pips), they should be considered support and resistance levels.
Support and Resistance levels are the levels that serve as targets when buying or selling the pair. You can place Take Profit near these levels.
Red lines are channels or trend lines that display the current trend and show in which direction it is better to trade now.
The MACD indicator (14, 22, and 3) consists of a histogram and a signal line. When they cross, this is a signal to enter the market. It is recommended to use this indicator in combination with trend patterns (channels and trendlines).
Important announcements and economic reports that can be found on the economic calendar can seriously influence the trajectory of a currency pair. Therefore, at the time of their release, we recommend trading as carefully as possible or exiting the market in order to avoid sharp price fluctuations.
Beginners on Forex should remember that not every single trade has to be profitable. The development of a clear strategy and money management is the key to success in trading over a long period of time.
InstaForex analytical reviews will make you fully aware of market trends! Being an InstaForex client, you are provided with a large number of free services for efficient trading.


