 Stay
Stay 
Trading Conditions
Products
Tools


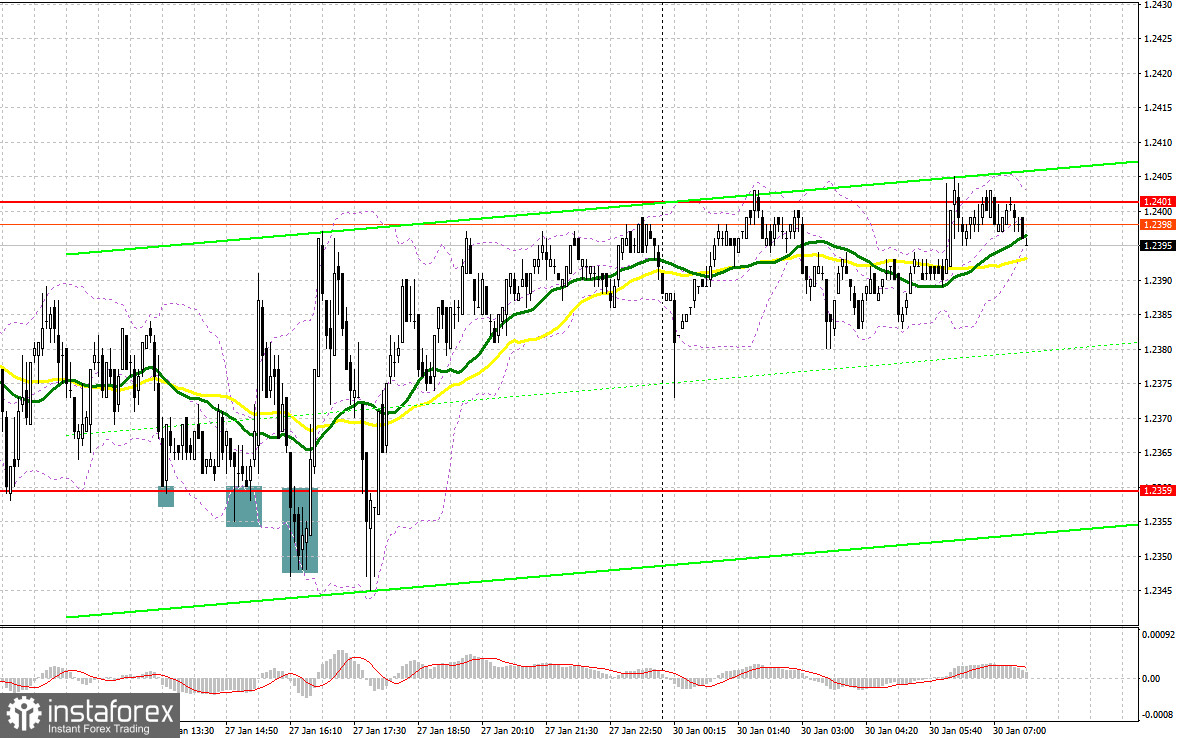
Last Friday, there were several entry points. Now, let's look at the 5-minute chart and figure out what actually happened. In the morning. the market was flat. Given the low volatility, the pair failed to test the levels I indicated in the morning. For this reason, there were no entry points. In the afternoon, after the release of US data, the pound sterling dropped against the US dollar, which led to several false breakouts of 1.2359 and created a buy signal. Price jumps totaled 30 and 35 pips, respectively.
When to open long positions on GBP/USD:
The economic calendar for the UK is empty again. For this reason, the pound sterling is likely to be moving in the sideways range. However, there are signs of a strong bullish bias. The pound sterling is growing gradually amid expectations of the BoE's hawkish move, which is bearish for the US dollar. The PCE Price Index released last week made traders more confident that the Fed would act more cautiously at its meeting than it did before. In my opinion, the most favorable scenario is to buy the pound sterling on a decline to 1.2357 as it was last Friday. A false breakdown there, similar to the one I have discussed above, could trigger a rise above 1.2403. The pair is trading now near this level. In case of consolidation and a downward retest of this level, a sharper upward movement to a high of 1.2444 may take place. A rise above this level will also allow the bulls to push the price to 1.2487 where I recommend locking in profits. If the pair does not approach 1.2357, the pressure will escalate, which will lead to a large correction. For this reason, I would advise you not to rush to open long positions. It is better to purchase on a decline and a false breakout near the low of 1.2308. You could buy GBP/USD at a bounce from 1.2266, keeping in mind an upward intraday correction of 30-35 pips.
When to open short positions on GBP/USD:
The bears tried to take control of 1.2357 but it turned out not to be so simple. Even though they are still in control, it is quite difficult to talk about what trend will eventually prevail. The closer the meetings of central banks are, the more traders are willing to buy the pound in anticipation of further rate increases by the Bank of England. The fact that the pair is trading near moving averages indicates market uncertainty before the meeting. Now, the main task is to protect the resistance level of 1.2403 formed last Friday. In the case of an upward movement in the morning, a false breakout of 1.2403 will provide a good selling opportunity with the prospect of a drop to 1.2357. A breakout and an upward retest will undermine the bullish sentiment, creating a sell signal with a move to 1.2308. Its test will indicate an attempt to form a new downtrend. A more distant target will be the 1.2266 level where I recommend locking in profits. If GBP/USD moves up and bears show no energy at 1.2403, the bulls will again take the upper hand. In this case, only a false breakout of 1.2444 will give an entry point into short positions with the aim of moving down. If bears do not make attempts to initiate a downward movement, you could sell GBP/USD at a bounce from a high of 1.2487, keeping in mind a downward intraday correction of 30-35 pips.

COT report
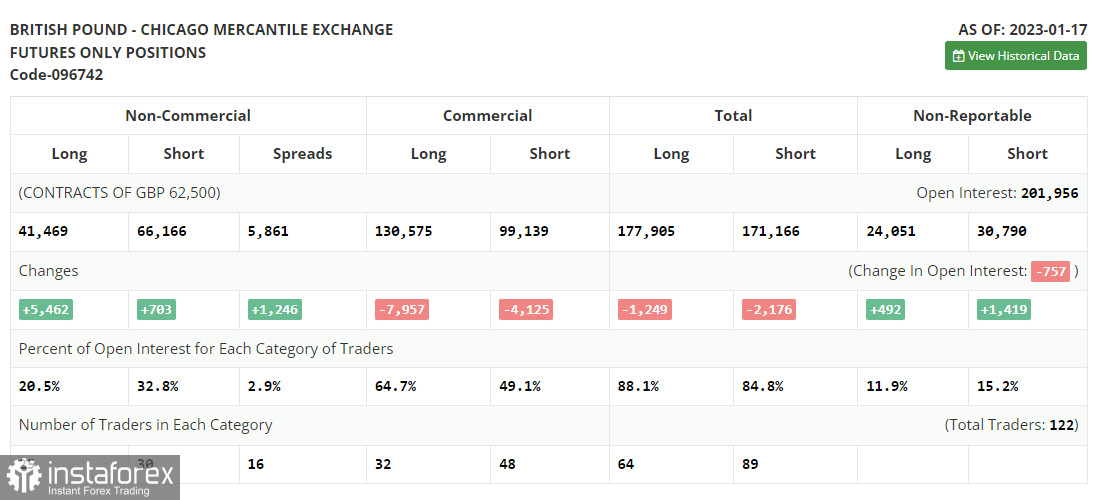
According to the COT report from January 17, the number of both long and short positions increased. It is important to understand that the Fed's aggressive policy is no longer as effective as it used to be. A slowdown in economic growth and a decrease in retail sales are the first signals of a looming recession in the US. At the same time, the Bank of England keeps combating inflation. Although inflation is a bit lower, it is still not enough for the regulator to alter its monetary stance. Therefore, aggressive tightening is likely to go on. This may allow the pound sterling to recoup previous losses. The recent COT report unveiled that the number of short non-commercial positions climbed by 703 to 66,166, while the number of long non-commercial positions surged by 5,4628 to 41,469. Consequently, the non-commercial net position came in at -24,697 versus -29,456 a week ago. These are insignificant changes. Therefore, they are unlikely to affect the market sentiment. That is why traders should monitor macroeconomic reports from the UK as they may drop a hint about the plan of the BoE. The weekly closing price increased to 1.2290 from 1.2182.
Indicators' signals:
Trading is carried out near the 30 and 50 daily moving averages, which indicates market uncertainty.
Moving averages
Note: The period and prices of moving averages are considered by the author on the H1 (1-hour) chart and differ from the general definition of the classic daily moving averages on the daily D1 chart.
Bollinger Bands
If GBP/USD moves up, the indicator's upper border at 1.2403 will serve as resistance. In case of a drop, the indicator's lower border at 1.2357 will act as support.
Description of indicators
InstaForex analytical reviews will make you fully aware of market trends! Being an InstaForex client, you are provided with a large number of free services for efficient trading.


