 Stay
Stay 
Trading Conditions
Products
Tools


When to open long positions on GBP/USD:
In the morning, there were no entry points. Now, let's look at the 5-minute chart and figure out what actually happened. The pair failed to reach the target levels due to low volatility before the Fed and the BoE meetings. So, there were no market signals. The technical outlook for the afternoon remained the same.
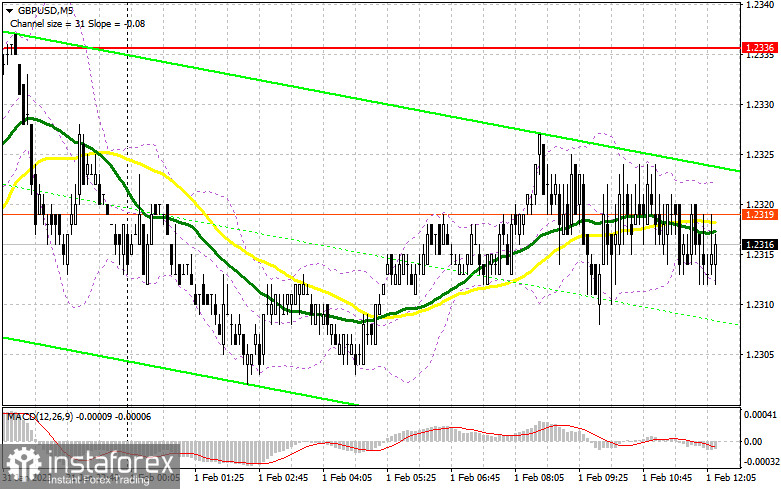
The market reaction to the Fed meeting is rather unpredictable. If the central bank decides to move to less aggressive tightening, the pound sterling could rise higher. Its upward potential is also high amid expectations of further rate increases by the Bank of England. Bulls may push the pair above the resistance level of 1.2336 thanks to the weak ADP report. However, they need also to take control of 1.2284. The pair is likely to hit this level if Jerome Powell surprises speculators with his comments. In case of a positive reaction to the US data, a false breakout of 1.2284, similar to the one I analyzed this morning, may help the pair to reach 1.2336. Now, trading is carried out near this level. The moving averages are limiting the upward movement. So, it will not be easy for buyers to take control of this level. If the pair consolidates above this level and there is a downward retest of this level after the Fed's meeting, GBP/USD could advance to a high of 1.2390. A jump above this level could facilitate a rise to 1.2444. However, such a scenario looks likely only if the Fed moves to a dovish stance. I recommend locking in profits at that level. If the bulls fail to push the pair to 1.2284 even before the Fed meeting results, the pressure on GBP/USD will escalate. It may trigger a large correction. For this reason, I would advise you to postpone purchases. It is better to open long positions on a decline and after a false breakout near the low of 1.2237. You could also buy GBP/USD at a bounce from 1.2172, keeping in mind an upward intraday correction of 30-35 pips.
When to open short positions on GBP/USD:
Sellers are still sitting on the sidelines. The fact is that even if the tone of Jerome Powell's speech is hawkish, traders could take them with a pinch of salt. Besides, he may also make rather dovish statements. The pair is practically trading near the moving averages. It indicates market uncertainty before the Fed and Bank of England meetings. This is why the bears are so cautious. Their main task is to protect the resistance level of 1.2336 where the moving averages are passing. In case of an upward movement in the afternoon, a false breakout of 1.2336 will give a sell signal with the prospect of further decline to the support level of 1.2284 formed yesterday. A breakout and an upward retest of this level will boost the bearish sentiment. It will create a new sell signal with a move to 1.2337. The test of this level will show an attempt to resume a new downtrend. A more distant target is the 1.2172 level. The pair could touch it only if the Fed raises the rate by 50 basis points instead of 25 basis points. At that level, I recommend locking in profits. If GBP/USD climbs and bears show no activity at 1.2336, the bulls will again take control. In this case, only a false breakout of 1.2390 will give an entry point into short positions with the prospects of a further decline. If bears show no energy there, you could sell GBP/USD at a bounce from a high of 1.2444, keeping in mind a downward intraday correction of 30-35 pips.

Commitments of Traders:
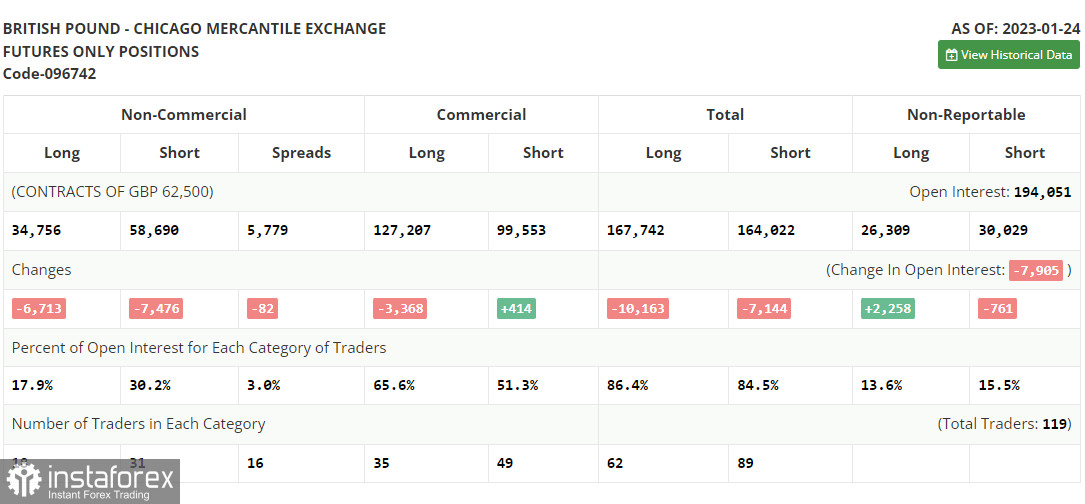
The COT report for January 24 logged a drop in both long and short positions. However, this drop was rather limited, especially given the problems the UK is going through now. The government has to deal with strikes for fair pay. Besides, inflation remains stubbornly high. Nevertheless, the US Fed and the Bank of England meetings are in the limelight. The US regulator is likely to move to a less aggressive tightening. Meanwhile, the BoE seems to be committed to a hawkish stance. It could raise the interest rate by 0.5%. In this case, the pound sterling may advance unless something extraordinary happens. According to the latest COT report, short non-commercial positions decreased by 7,476 to 58,690, and long non-commercial positions fell by 6,713 to 34,756. As a result, the non-commercial net position came in at -23,934 versus -24,697 a week ago. As seen, these changes are insignificant. They will hardly impact market sentiment. For this reason, it is important to monitor macroeconomic reports in the UK and the BoE's rate decisions. The weekly closing price rose to 1.2350 from 1.2290.
Indicators' signals:
Trading is carried out slightly below the 30 and 50 daily moving averages, which indicates market uncertainty.
Moving averages
Note: The period and prices of moving averages are considered by the author on the H1 (1-hour) chart and differ from the general definition of the classic daily moving averages on the daily D1 chart.
Bollinger Bands
If GBP/USD moves up, the indicator's upper border at 1.2336 will serve as resistance.
Description of indicators
InstaForex analytical reviews will make you fully aware of market trends! Being an InstaForex client, you are provided with a large number of free services for efficient trading.


