 Stay
Stay 
Trading Conditions
Products
Tools


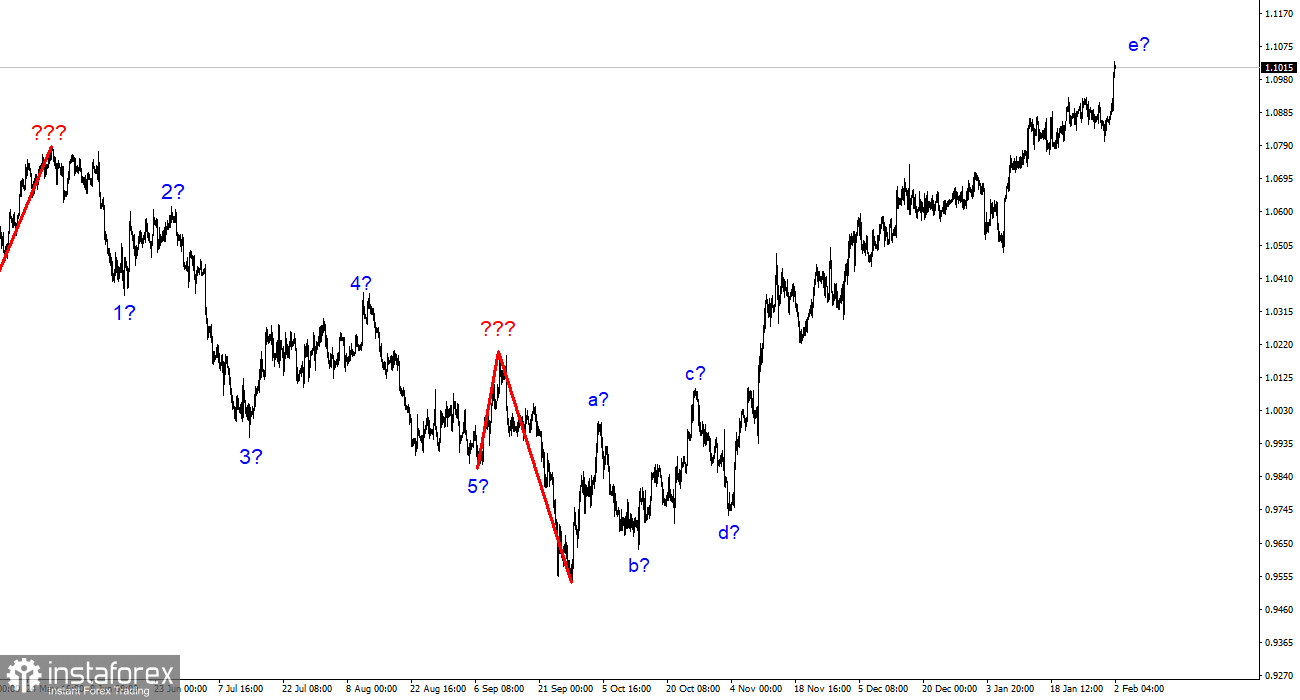
The EUR/USD wave layout on the 4-hour chart has not changed at all lately and remains rather complex. The ascending section of the trend has taken a clearly corrective and extended form which looks more like a momentum section. So, we have a complex corrective wave pattern consisting of a-b-c-d-e parts where wave e has a more complex structure than the previous four waves. If the current wave setup is correct, then this structure may be nearing its completion or has already been completed as the peak of the wave e is much higher than the peak of the wave c. If so, we can expect the formation of at least three descending waves. So, I still anticipate a decline in the pair. In the first weeks of the year, the demand for the euro was either rising or remained consistently high. In this period, the instrument retreated from the reached highs only once. Yesterday, the demand for the euro surged again. A successful attempt to break through the 1.0953 level, which corresponds to the 161.8% Fibonacci level, indicates that the marker stays bullish on the pair.
EUR up despite easing inflation
On Wednesday, the euro/dollar pair advanced by 130 pips when market activity increased amid the publication of the FOMC results. We'll talk about them later and now let's discuss another important report on EU inflation. The headline inflation rate dropped to 8.5% on year. At the same time, traders continued to buy the euro which is strange because lower inflation means that the ECB may soon ease its monetary policy. I think the answer lies in the core inflation rate which remained at 5.2% in January and showed no decline. Some analysts consider only core inflation while others evaluate only the headline inflation rate. Yet, the fact is that the market reacted only to the core inflation data which hasn't decreased. This means that the European regulator may continue to hike the rate at the previous pace which boosted demand for the euro.
As I have mentioned several times, the current ascending section of the trend has become too long. Of course, it can get extended an unlimited number of times which complicates the trading process. The formed wave structures are not common. I thought that yesterday the instrument would initiate the descending section of the trend but the market stayed bullish. It seems that any mixed data is interpreted in favor of the euro. Today, the ECB will announce its decision on interest rates which may drive EUR even higher. The regulator is expected to lift the rate by 50 basis points. As far as I see it, this event has already been priced in by the market. Still, the pair may advance today as traders are poised to buy the euro.
Conclusion
Based on the analysis above, I can conclude that the ascending section of the trend is nearing its completion. With this in mind, I would recommend selling the pair with the targets located at 1.0350, which corresponds to the 261.8% Fibonacci level. It is also highly possible that the ascending section of the trend will get a more extended form. A failed attempt to break through 1.1157 will indicate that the market is ready to complete wave e.
On higher time frames, the wave layout of the descending section of the trend is getting longer and more complex. We have identified five ascending waves that most likely make up the a-b-c-d-e pattern. The pair may start a downtrend as soon as this trend section is completed.
InstaForex analytical reviews will make you fully aware of market trends! Being an InstaForex client, you are provided with a large number of free services for efficient trading.


