 Stay
Stay 
Trading Conditions
Products
Tools


The Bank of England and the European Central Bank held their meetings at once. Both banks decided to raise the interest rate by 50 basis points.
The Bank of England raised its rate for the tenth time in a row to 4%, reaching its highest level since 2008. The market had expected this decision, but the regulator hinted that rates are close to their peak. It could thus serve as a signal that the next rate hikes are unlikely to be more than 25 bps.
The result of all this was the weakening of the British pound.
As for the ECB, the base interest rate has risen to 3%, which is also the highest since 2008. In its statement, the regulator noted that the ECB board will stick to the initiated course, which includes a significant increase in interest rates at a stable pace. Given the pressure of inflation, interest rates are expected to be raised again at the next meeting on monetary policy in March.
Even though the regulator clearly indicated a further increase in interest rates, the euro began to weaken. It might have been triggered by ECB President Christine Lagarde's statement that there might be a revision of the monetary policy approach after the March interest rate hike. Investors took those words as a signal that a series of rate hikes followed by a rate cut is imminent.

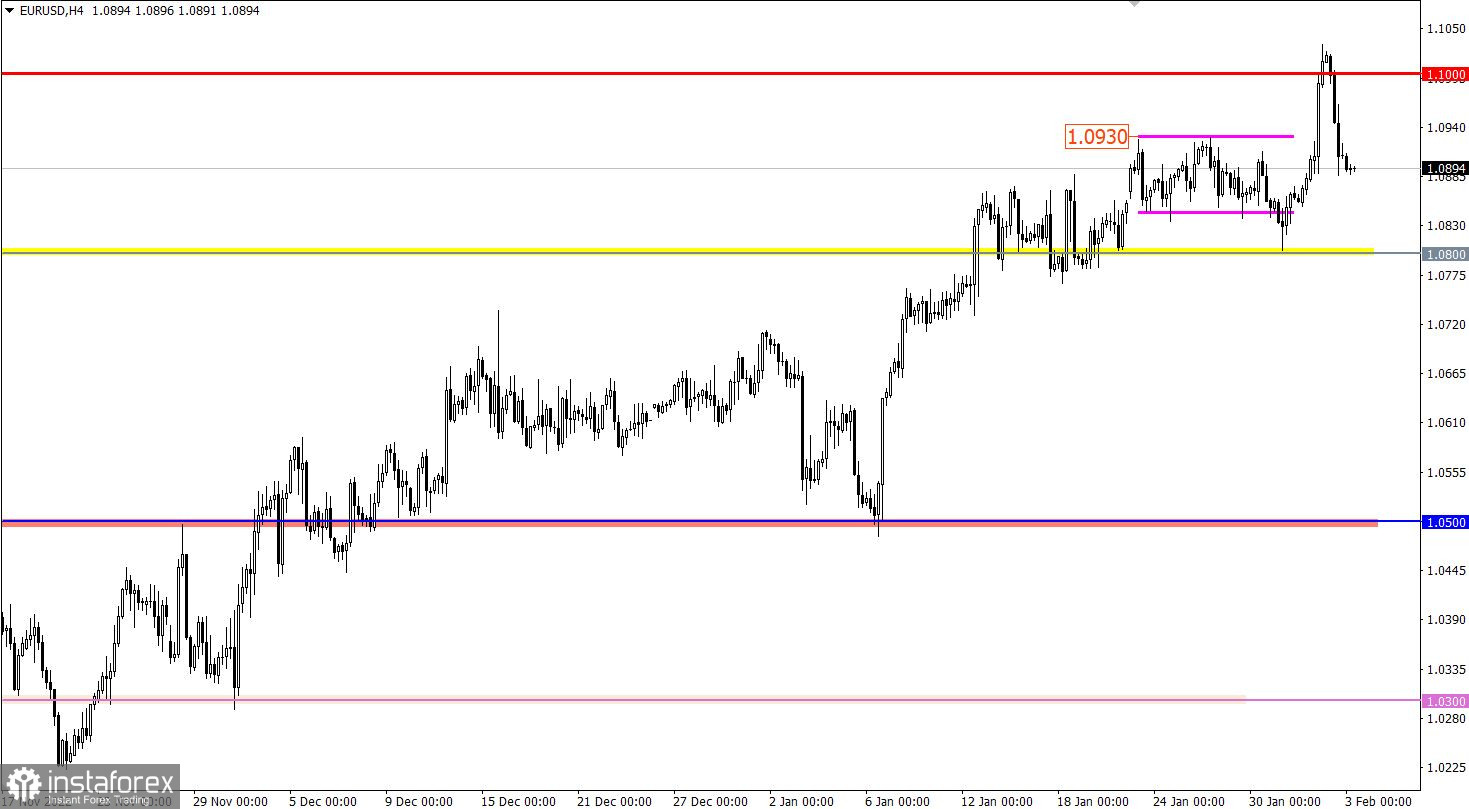
The EURUSD currency pair showed speculative activity due to the strong information and news background. During this, the euro fell by more than 130 points. As a result, the quote again returned below the value of 1.0900.
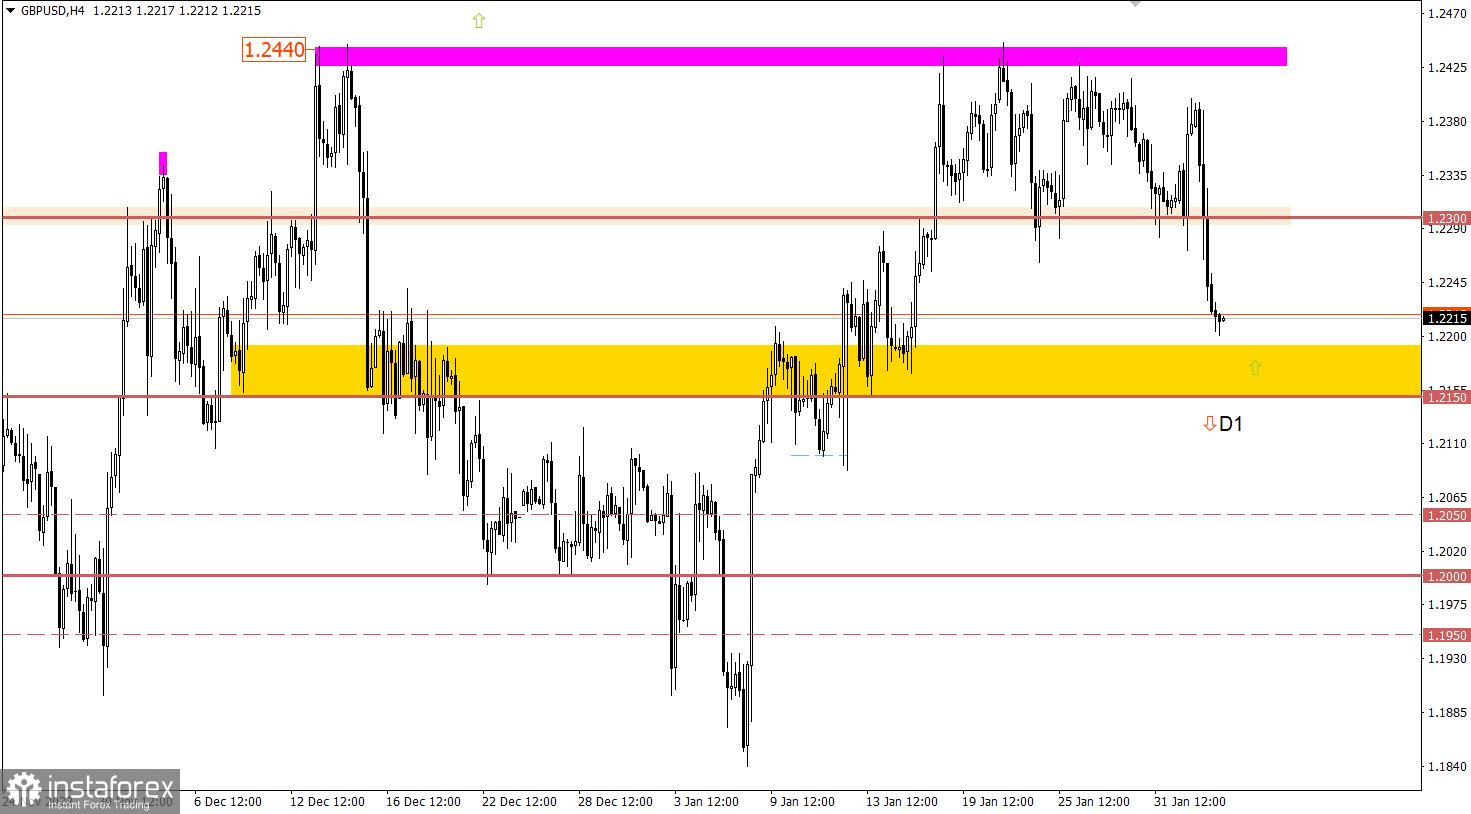
The GBPUSD currency pair, amid the results of the Bank of England meeting, completed the formation of the side channel 1.2300/1.2440 by breaking its lower border. As a result, there was a sharp increase in the volume of short positions, which led to the emergence of an inertial move.
One of the main events of the outgoing week is the United States Department of Labor report, which is likely to affect the market and speculators.
Unemployment rate is estimated to rise from 3.5% to 3.6%. This is the primary signal that the situation on the labor market is starting to deteriorate, which is why the U.S. dollar may be under selling pressure.
Time targeting:
United States Department of Labor Report – 13:30 UTC
A sharp change in the euro exchange rate could lead to an oversold status in the short term. This, in turn, could lead to a slowdown in downward momentum, leading to a technical pullback. However, speculators may ignore technical signals, in which case holding the price below 1.0850 may well send the price towards the level of 1.0800.
If the downward cycle continues in the market, the pound sterling may fall to the level of 1.2150, where the area of interaction of trading forces is located. Already relative to this level, a sharper reduction in the volume of short positions may well occur due to a technical signal that the pound is oversold.
As for the alternative scenario, it is just considered in the values of 1.2150/1.2200, where the area of interaction of trading forces is located.
The candlestick chart type is white and black graphic rectangles with lines above and below. With a detailed analysis of each individual candle, you can see its characteristics relative to a particular time frame: opening price, closing price, intraday high and low.
Horizontal levels are price coordinates, relative to which a price may stop or reverse its trajectory. In the market, these levels are called support and resistance.
Circles and rectangles are highlighted examples where the price reversed in history. This color highlighting indicates horizontal lines that may put pressure on the asset's price in the future.
The up/down arrows are landmarks of the possible price direction in the future.
InstaForex analytical reviews will make you fully aware of market trends! Being an InstaForex client, you are provided with a large number of free services for efficient trading.


