 Stay
Stay 
Trading Conditions
Products
Tools


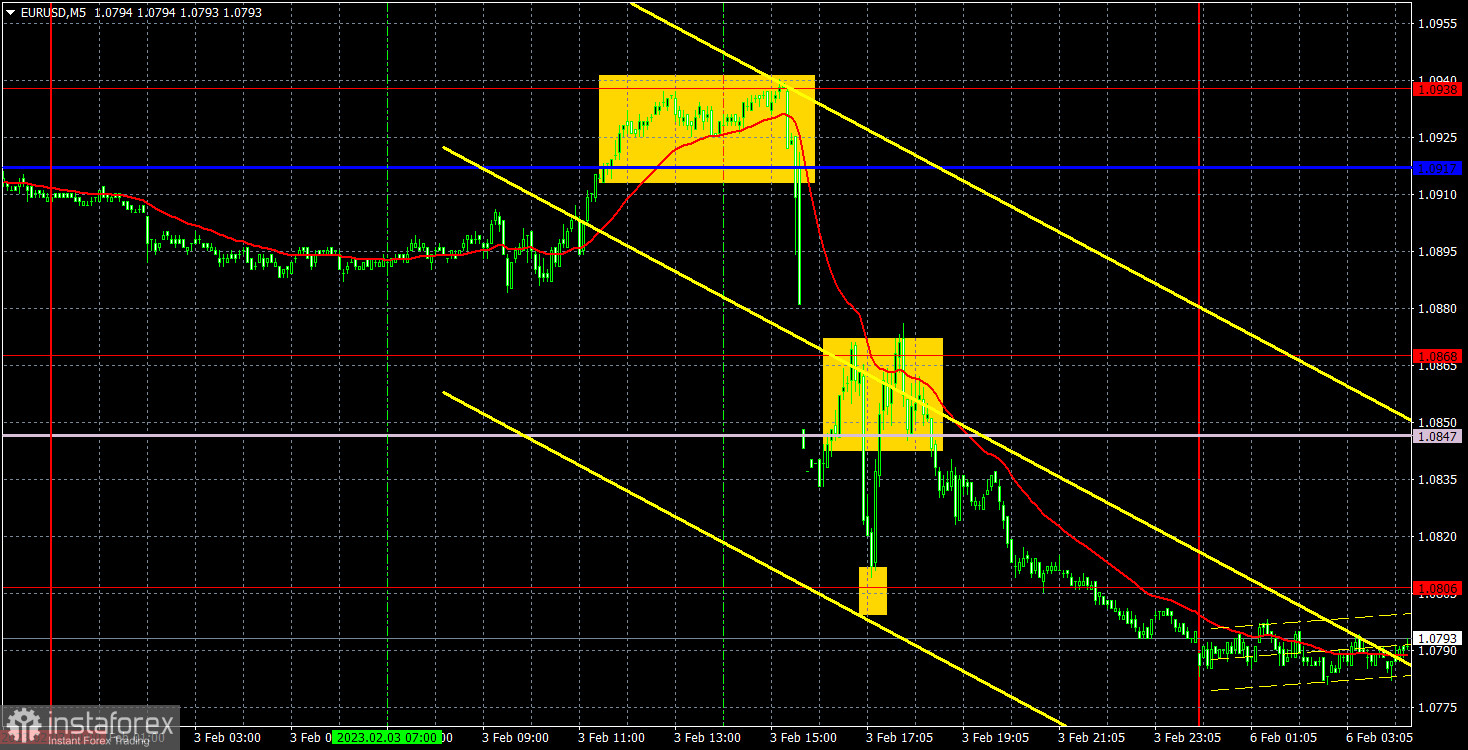
On Friday, EUR/USD plunged again on the back of the labor market results in the United States. Unemployment in the country fell to 3.4%, and NFPs exceeded expectations by 2.5 times. The greenback encountered strong support across markets. As a result, the euro/dollar pair plummeted. All in all, we have not seen a downtrend for quite a while. So, things are now unfolding as they should. Of course, US jobs market data is of no use to the euro, which has been bullish without any reason for a long time. Moreover, it has also been overbought. The pair is now moving down below the Ichimoku indicator. This week, the price will be less volatile due to an almost empty macroeconomic calendar. Therefore, a minor bullish correction may occur.
A few trading signals were generated on Friday, and they were hard to price. The first sell signal was made when data on the US jobs market came. The pair bounced off the 1.0917-1.0938 range, but it was difficult to enter the market in time. Traders who caught the last-minute train yielded a profit of about 80-100 pips due to a fall in price to the 1.0806 mark. A buy signal near this level could have been priced. However, we believe that it was unwise to open long positions because the US data came upbeat.
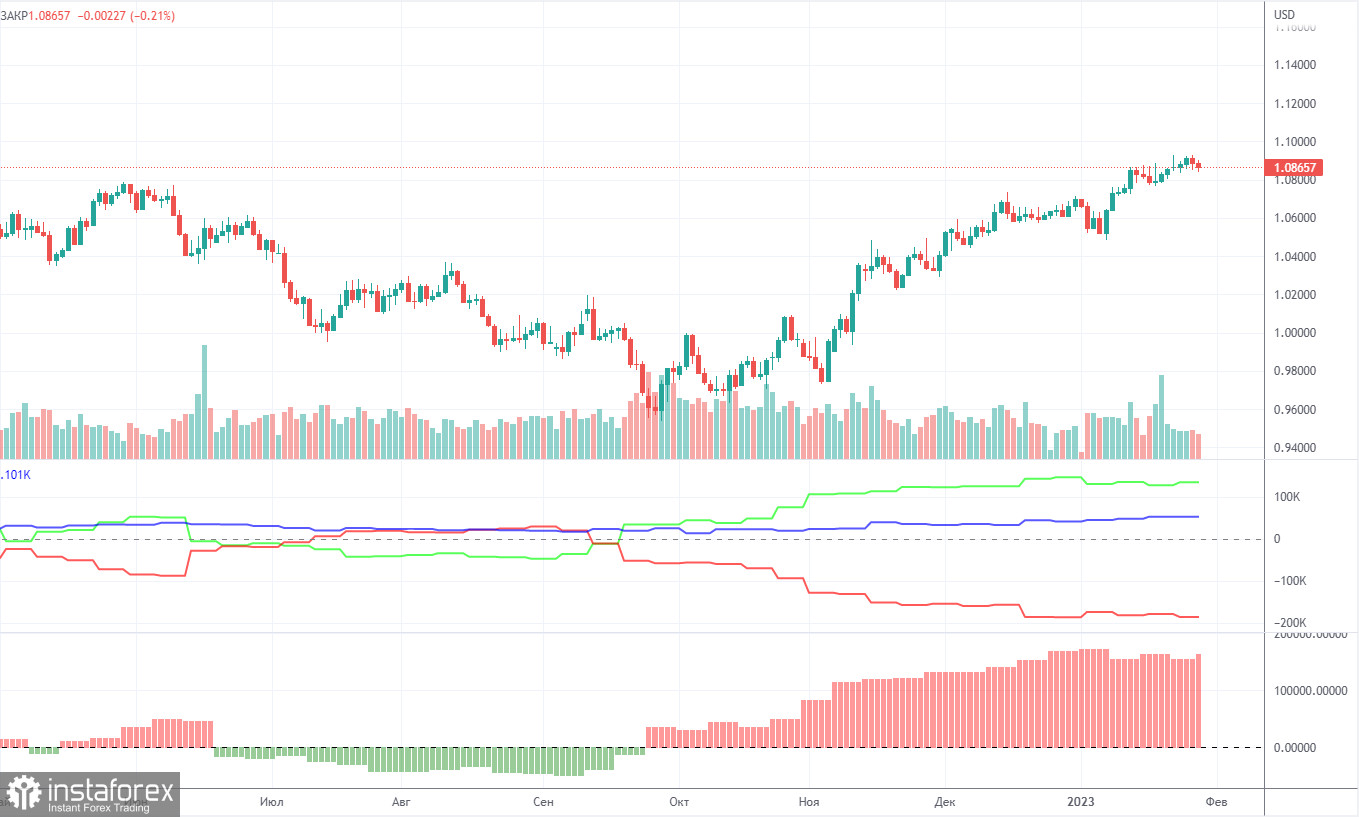
The COT reports on EUR/USD have been in line with expectations in recent months. The net non-commercial position has been on the rise since September. The bullish non-commercial position rises with each new week. Taking into account this fact, we may assume that the uptrend will soon come to an end. The red and green lines of the first indicator are far apart, which is usually a sign of the end of a trend. In the reporting week, non-commercial traders opened 9,500 long positions and 2,000 short ones. The net non-commercial position grew by 7,500. The number of long positions exceeds that of short ones by 134,000. It now remains to be seen how long large traders will be bullish. From the technical point of view, a bearish correction should have already occurred. Traders will unlikely stay bullish for another 2 or 3 months. Even the net non-commercial position shows that it is time for a correction. In total, there are 52,000 more long positions now among all groups of traders (732,000 vs 680,000).
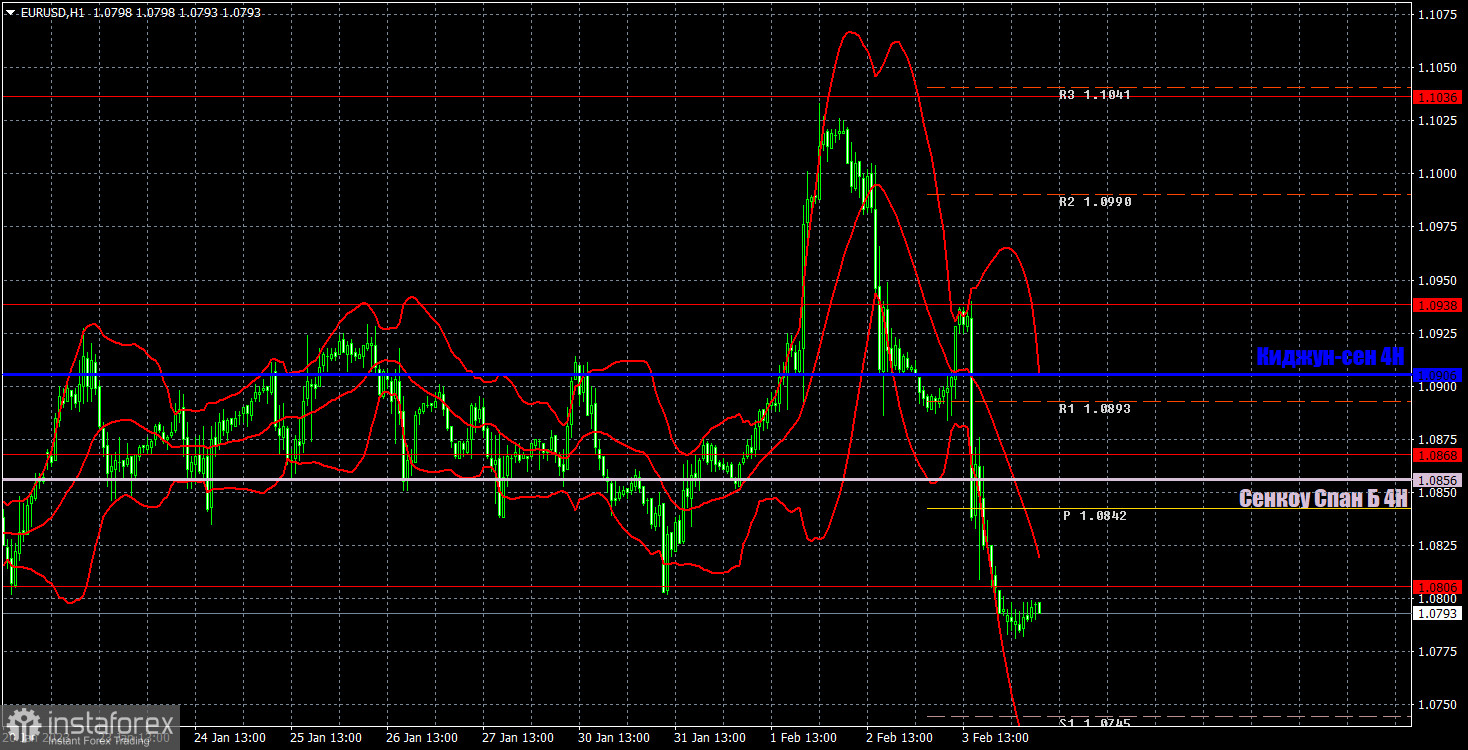
According to the H1 time frame, the pair is trying to enter a downtrend. However, it is still moving sideways. Volatility has increased. This week, the price may trade sideways due to a lack of macro events. Anyway, we expect a bearish continuation. On Monday, important levels are seen at 1.0658-1.0679, 1.0736, 1.0806, 1.0868, 1.0938, 1.1036, and 1.1137 as well as Senkou Span B (1.0856) and Kijun-sen (1.0906). Ichimoku indicator lines can move intraday, which should be taken into account when determining trading signals. There are also support and resistance although no signals are made near these levels. They could be made when the price either breaks or rebounds from these extreme levels. Don't forget to place Stop Loss at the breakeven point when the price goes by 15 pips in the right direction. In case of a false breakout, it could save you from possible losses. On February 6, the eurozone will see the release of a retail sales report. ECB President Lagarde will deliver a speech. No macro releases are scheduled in the United States. Traders are unlikely to be interested in Lagarde's speech because they do not expect her speech to carry any new information.
Resistance/support - thick red lines, near which the trend may stop. They do not make trading signals.
The Kijun-sen and Senkou Span B lines are the Ichimoku indicator lines moved to the hourly timeframe from the 4-hour timeframe. They are also strong lines.
Extreme levels are thin red lines, from which the price used to bounce earlier. They can produce trading signals.
Yellow lines are trend lines, trend channels, and any other technical patterns.
Indicator 1 on the COT chart is the size of the net position of each trader category.
Indicator 2 on the COT chart is the size of the net position for the Non-commercial group of traders.
InstaForex analytical reviews will make you fully aware of market trends! Being an InstaForex client, you are provided with a large number of free services for efficient trading.


