 Stay
Stay 
Trading Conditions
Products
Tools


Friday's main event was the United States Department of Labor report, which caused a strong reaction in the financial markets.
Report details:
- Unemployment fell to 3.4% from 3.5%, with a forecast increase to 3.6%.
- Change in the number of people employed in the non-agricultural sector (January) +550,000, with a forecast of +185,000. We have indicators above December.
- Average hourly wages fell to 4.4% YoY from December's 4.9%.
The statistics turned out to be better than all forecasts. A strong January jobs report indicates that the U.S. economy can handle further interest rate hikes. As a result, the U.S. dollar strengthened in the financial markets.

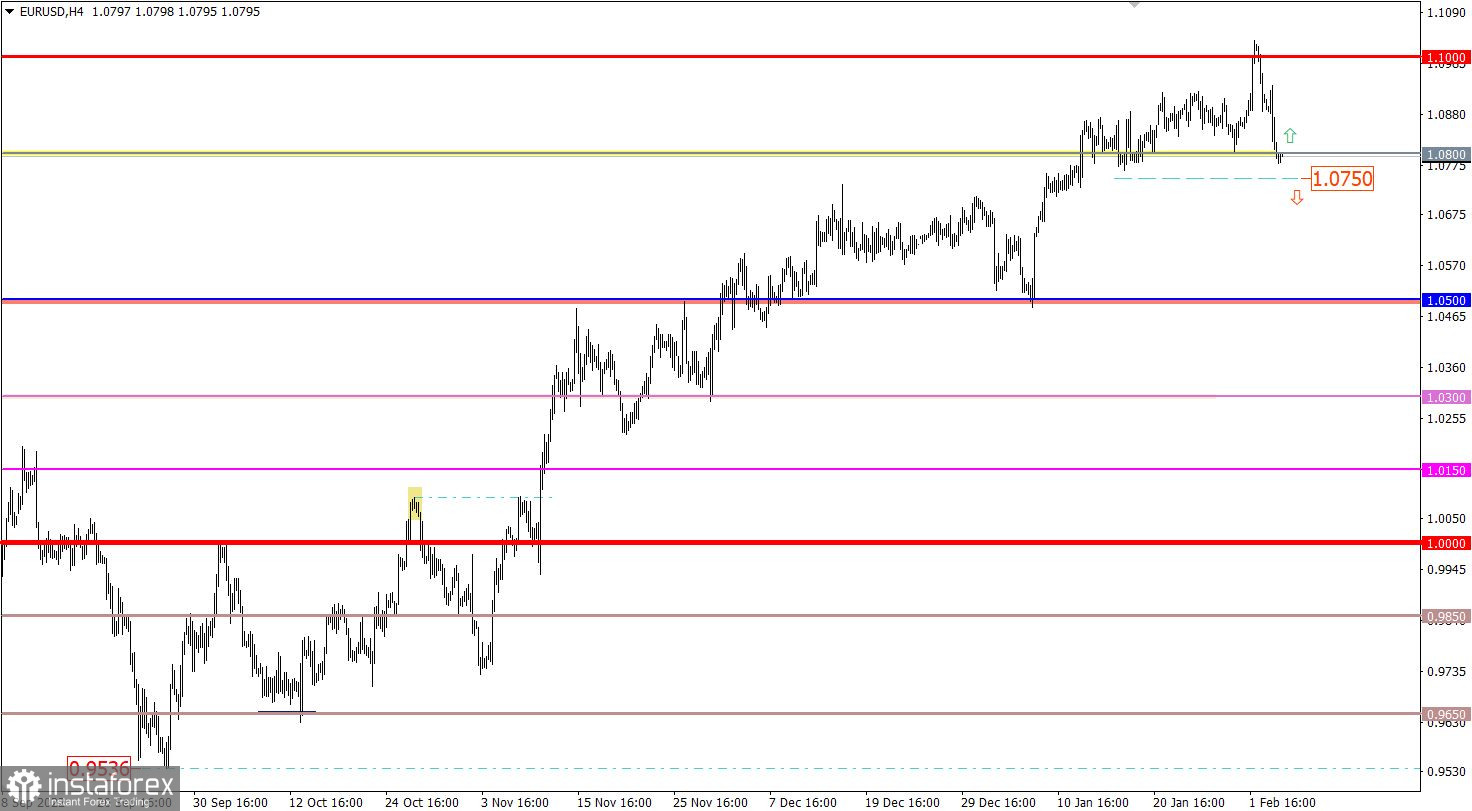
The EURUSD currency pair accelerated its decline due to the strong information and news background. As a result, the quote not only reached the level of 1.0800, it managed to stay below it in a four-hour period. This price move at least indicates a slowdown in the upward trend.
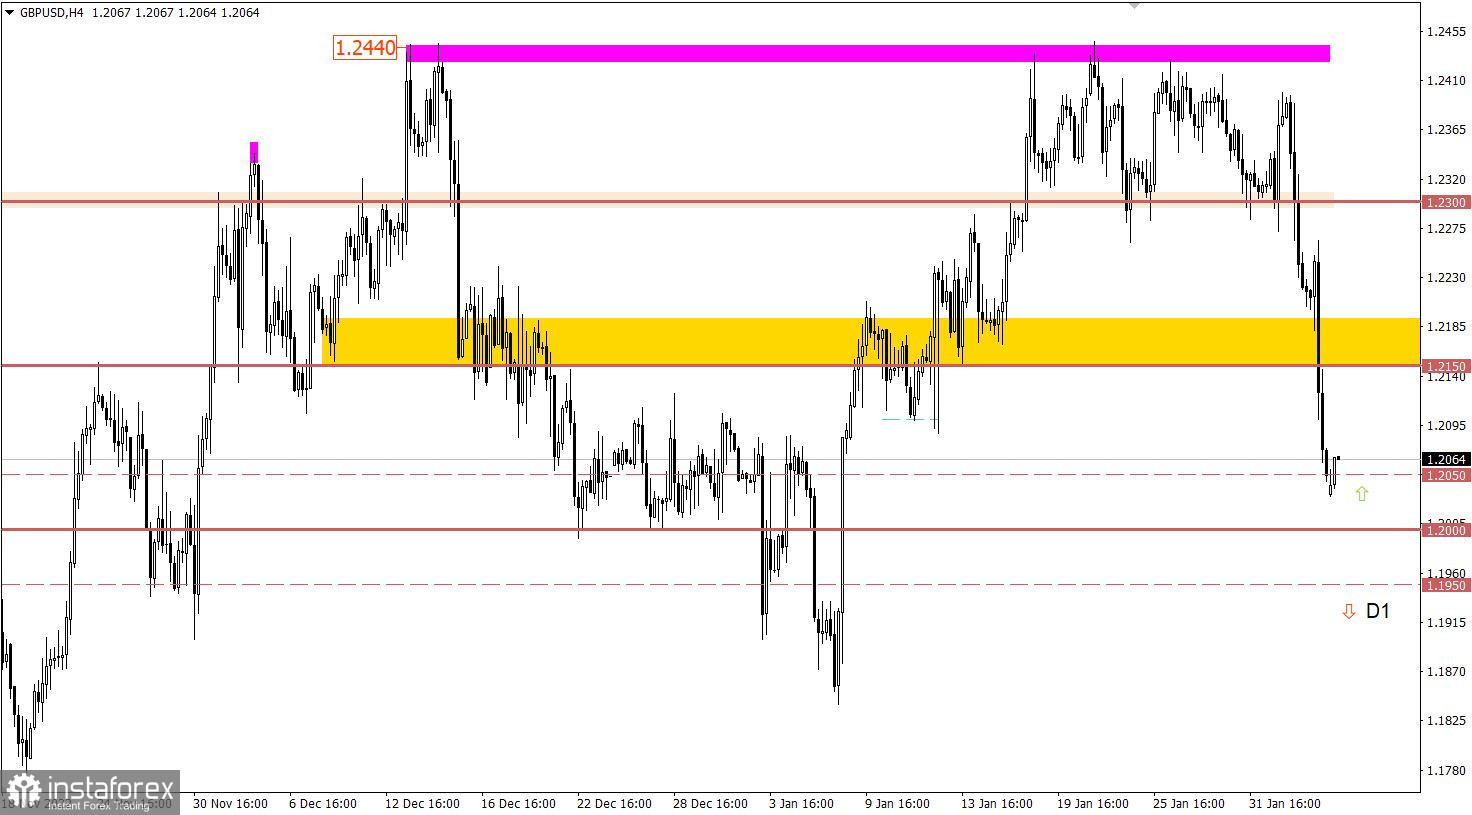
The GBPUSD currency pair, during the inertial downward movement, came close to the 1.2000 psychological level. In view of the fact that the market has a status of oversold pound sterling, as well as the convergence of the price with the control level, there was a reduction in the volume of short positions. This slowed down the inertial movement.
Statistics from the U.K. and the European Union are expected.
UK construction PMI for January is estimated to rise from 48.8 to 49.6. The construction sector is an important part of the British economy.
EU retail sales may slowdown its decline from -2.8% to -2.6% in annual terms.
Time targeting:
United States Department of Labor Report – 13:30 UTC
In order to consolidate the sellers' positions on the euro, the quote needs to hold below the value of 1.0750. In this case a subsequent decline in the euro rate in the direction of 1.0650–1.0500 is possible.
As for the reversal, it is also considered by the traders in the scenario of the price rebound from the level of 1.0800. In this case the technical signal of an oversold euro, caused by the inertial move, is taken into account.
The absence of a breakdown of the psychological level will lead at least to stagnation. Ideally, the 1.2000 level will play the role of support, in this case, a pullback in the direction of 1.2150 is possible.
As for the prolongation of the downside scenario, it will be considered by traders if the price remains below 1.1950, preferably in the daily period.
The candlestick chart type is white and black graphic rectangles with lines above and below. With a detailed analysis of each individual candle, you can see its characteristics relative to a particular time frame: opening price, closing price, intraday high and low.
Horizontal levels are price coordinates, relative to which a price may stop or reverse its trajectory. In the market, these levels are called support and resistance.
Circles and rectangles are highlighted examples where the price reversed in history. This color highlighting indicates horizontal lines that may put pressure on the asset's price in the future.
The up/down arrows are landmarks of the possible price direction in the future.
InstaForex analytical reviews will make you fully aware of market trends! Being an InstaForex client, you are provided with a large number of free services for efficient trading.


